This is a quick note, which tends to be just off the cuff thoughts/ideas that look at current market situations, and to try to encourage some discussions.
As usual, a reminder that I am not a financial professional by training — I am a software engineer by training, and by trade. The following is based on my personal understanding, which is gained through self-study and working in finance for a few years.
If you find anything that you feel is incorrect, please feel free to leave a comment, and discuss your thoughts.
Burry
About 2 quarters ago, Michael Burry (of “Big Short” fame) started shorting long term Treasuries quite aggressively. Basically, it seems like he was betting that long term interest rates would be going up in the nearish future — it didn’t (and hasn’t). That didn’t seem to deter him — he modified his bets somewhat, but he is still, essentially, short long term Treasuries.
Over the weekend, Youtube recommended this video to me, which does a reasonably good job of discussing Burry’s bets, and what they really mean. Essentially, it seems like Burry is betting that inflation will rise, and the Fed will raise rates to counter that inflation.
If you look at Burry’s portfolio, you’ll also notice that he’s very heavily in things that I suggested in the June 6 inflation post may be good inflation hedges — consumer staples, real estate (housing), healthcare, utilities(-like) companies that have fixed costs and floating prices.
So, it seems like Burry’s betting heavily on inflation.
Which is to say, Burry’s bet on interest rates rising are probably not doing well right now, and Powell appears to disagree with his inflation bets as well.
Clarifications
And finally, some clarifications on the June 6 inflation post. In various forums which discussed that post, some people brought up some points which seem to misunderstand the post. So to clarify:
I believe the Fed will do something to counter high inflation, if it happens. In particular (and as noted in the prior post), I’m expecting the first rate hike to happen sometime in the 2022 – 2023 period.
I had previously thought the Fed would act earlier (in 2021), but Yellen’s speech (see prior post for link) made me change my mind to the new 2022 – 2023 time frame.
I expect the Fed will be able to counter inflation. It may require drastic actions (see 1970’s and Volcker’s policies), but it seems like they have the necessary tools. Which is also why I don’t expect elevated inflation (i.e.: more than 2.5%) to last more than ~2 years (starting from the June post).
Inflation is the rate of change of prices — not actual prices. And no, I do not expect deflation in the near/medium term (say 2-5 years). Which is to say, I expect the increase in (average consumer) prices to remain. But the higher rate of increase of prices (i.e.: higher inflation) to be transitory.
So yes, this “up to 2 years of elevated inflation” would be painful, especially for those who are most financially vulnerable.
The Efficient Market Hypothesis (EMH) is often cited, or at least alluded to, as the reason why everyone should just buy a basket of all stocks in the market, and then hold them passively. (1)
However, while I believe that the general advice is reasonable (2), the premise is, I believe, flawed.
As usual, a reminder that I am not a financial professional by training — I am a software engineer by training, and by trade. The following is based on my personal understanding, which is gained through self-study and working in finance for a few years.
If you find anything that you feel is incorrect, please feel free to leave a comment, and discuss your thoughts.
The gist of EMH is best summarized by a quote from the very first paragraph of that paper:
A market in which prices always “fully reflect” available information is called “efficient”.
Fama, E. (1970). Efficient Capital Markets: A Review of Theory and Empirical Work. The Journal of Finance,25(2), 383-417. doi:10.2307/2325486
Note the key words: “always”, “fully reflect”, “available information”.
In other words, the EMH proposes that any public information is instantaneously (i.e.: always + fully reflected) incorporated into the prices of any securities affected by that information.
Models, models everywhere and not a single forecast to trade on
There are 2 main reasons why I believe the EMH is wrong — one is a technical reason, and the other is based on empirical observations.
Technically speaking…
The EMH is not really a hypothesis, so much as it is a model. It is a model of how financial instruments are supposed to behave, and the idea is that using that model, you can then make reasonable deductions about financial assets (or more accurately, their prices).
By definition, a model is a simulacrum of the original — models abstract away certain details of the original, to achieve a simplified representation.
Therefore, models are, by definition, wrong — when you remove certain aspects of the original in order to achieve the model, you are, in effect, creating something that is not a perfect reflection of the original, and thus it will never predict every single nuance of the original.
However, this doesn’t mean all models are useless! Within the assumptions on the parameters used to create the model, the model could very well be very predictive. For example, a simple model of the Sun is that it rises in the East and sets in the West. This is a model of how the Sun operates, but with the implicit assumption that you are observing the Sun on Earth, in a spot a little bit removed from the absolute North and South poles. If, say, you are observing the Sun from Mars, then this may not hold true any more. So, while this model is useful, because everyone I know is on Earth and none are on Mars, it is actually wrong — it implies the Sun revolves around the Earth in a prescribed path, instead of the other way around.
Ergo, all models are wrong, but some models are selectivelyuseful.
EMH? This. Is. Empirical!
Going back to definition of EMH, note that it explicitly states that publicly available information are instantaneously reflected in the prices of security. Well, how often do you hear market moving information about stocks? Maybe once a day? Once an hour? Every few minutes?
But how often do stock prices move? If you have access to tick level information on stock prices, you’ll notice that they literally move every few microseconds. Microseconds. Are there really “publicly available price moving news” every few microseconds? If not, then why are the stock prices moving if they supposedly “always ‘fully reflect’ available information”? (3)
At a more high level, there exists easily observed price discrepancies in the stock markets. Take, for example, the stock symbols GOOG and GOOGL. Both are stocks of Alphabet Inc., the parent company of Google. GOOG represent class C shares which have exactly the same financial/economic interests as GOOGL, the class A shares. However, GOOGL, the class A shares, have voting rights on top of the financial/economic interests, while GOOG, the class C shares, only have the financial/economic interests.
Given that GOOGL = GOOG + “voting rights”, and voting is optional — you can choose to vote or you can choose to abstain, which means voting rights have a value strictly above 0, we should arrive at the conclusions that GOOGL should always trade at least as high as GOOG, and possibly a little bit higher. Right?
GOOG vs GOOGL stock prices in the past ~5 months in 2021, courtesy of Interactive Broker’s Trader Workstation.
Well, would you look at that…
There are some who claim that prior to Q3 2021, because Alphabet Inc. does buybacks primarily via GOOG, therefore GOOG tends to trade at a higher price compared to GOOGL. I have no idea if that’s accurate, but on the face of it, it seems accurate enough — in Q3 Alphabet Inc. announced that they’ll also buyback GOOGL and the gap closed significantly.
Before the EMH crowd screams “Eureka!”… think about it. A stock buyback is essentially the company taking $N of cash and exchanging it for $N of its own stock. It is a financially and economically neutral move, i.e.: stock buybacks, according to the EMH, should not impact the company’s stock price at all.
Hypothetically speaking…
This is where I’ll admit that I was being a little misleading. If you read Fama’s paper in full, you’ll realize that he didn’t actually say that EMH is correct. In fact, he fully admits the hypothesis is wrong:
We shall conclude that, with but a few exceptions, the efficient markets model stands up well.
Fama, E. (1970). Efficient Capital Markets: A Review of Theory and Empirical Work. The Journal of Finance,25(2), 383-417. doi:10.2307/2325486
Note that he clearly stated there are “exceptions”, and that the “model” isn’t correct, but that it “stands up well”. More importantly, he doesn’t even call it a hypothesis, but a model.
Because a hypothesis is a proposition of what reality is, and as all budding scientists know, “no amount of experimentation can ever prove me right; a single experiment can prove me wrong”, i.e.: just a single counter example, or exception, can prove a hypothesis is wrong. And we have “a few exceptions” here.
Which is to say, it appears that Fama is fully aware that EMM(odel) is a model, with all that implies about a model. It is close enough to reality that it is a useful model in some cases, but it is wrong to assume that the model is always right.
Practically speaking…
In practice, the EMH is useful essentially when you are unable or unwilling (4) to delve deeper into the data. By abstracting away a lot of the complexities of modern financial system, the EMH provides a useful simplification of what happens in the markets, and allows us to ignore those parts of the markets which we don’t care to care about.
For example, when you are developing a trading algorithm for SPY, the number of things the perfect such algorithm will need to know about is basically limitless — interest rates, consensus interest rates predictions, possible Fed initiatives, major events happening around the world, etc. The list is, quite literally, endless.
To make a perfect trading algorithm for SPY is thus impossible. But that doesn’t mean that a profitable SPY trading algorithm cannot exist! The EMH suggests that for the most part, you can assume away most of the details, and focus only on those bits that you have an edge on. For example, maybe you really understand how interest rates and SPY interact. Well, then you can build a model and an algo off that model, which assumes everything else is priced in (5), and just trade based off your simplistic model. Maybe it works, maybe it doesn’t — the point is, the EMH does not predestine it to not work.
In other words — the EMH is useful if there are some things you simply don’t care to worry about right now. Maybe v2 of your model/algo will take those into account. But right now, you have money to make.
Passive investing
Coming back to “passive investing” (1) — if you are unable or unwilling (4) to delve deeper into the data/details, and you simply want a carefree, easy way of investing your money, passive investing is a reasonable answer (2). This is a corollary of “the EMH is useful if there are some things you simply don’t care to worry about right now” — in this case, you simply don’t care to worry about any of those things.
But understand that it is reasonable, only because you are willingly looking at the problem from 10’000 feet away, and thus missing a lot of the nuances and detail that others who are more attentive may see.
Footnotes
I intentionally avoided using “passive investing” in the foreword, because that term is often overloaded — some people mean “buy and hold” (i.e.: don’t trade too much), some people mean “buy baskets of stocks reflecting the total market” (i.e.: don’t do active stock selection), and some people mean both. For the sake of this article, I’m going with “both”.
It is “reasonable”, in that for most people, it is pretty good advice — most people are unlikely to do much better than simply passive investing (as defined in (1) above), though this is not always true in every case. Remember that financial planning isn’t about maximizing your returns, it is the reverse — it is about finding an acceptable level of return, then figuring out the least risky way of attaining that return. Therefore, in some cases, it may be reasonable to adjust your holdings. For example, if you work in tech and your company pays much of your salary in stock, it may make sense to hedge against a general tech stocks decline by overweighting non-tech stocks in your investing portfolio.
There are some who claim that the stock prices themselves are “publicly available information”, and thus, the “current” price move is just a reflection of the “prior” price move, i.e.: the stock price is moving because the stock price moved and generated new information. This is mostly circular reasoning that falls apart upon even cursory examination — as noted, the information must be “fully reflected” in the price “always”, which implies the information must be priced in instantaneously. There is simply no “prior” or “current” in an instant.
Unable here means, well, unable. It doesn’t necessarily mean “too stupid to”. Similarly, unwilling here means unwilling — it doesn’t necessarily mean “too lazy to”.
By the powers vested in me by the EMH, I pronounced all those factors I don’t care about “priced in”.
Nowadays, it seems everybody is chasing net worth — trying to be the next millionaire, billionaire, trillionaire, etc. I’ve talked to multiple people, all of whom look only at the balance of their portfolios, completely disregarding things like risk, liquidity, etc.
Thinking like that really only works when you have an infinite capacity to take on risk (which generally means you intend to live forever, amongst other things). Otherwise, it is important to remember that not all net worth are created equal.
Are you really rich, if you have $100m on paper, but are not allowed to spend a single cent of it?
As usual, a reminder that I am not a financial professional by training — I am a software engineer by training, and by trade. The following is based on my personal understanding, which is gained through self-study and working in finance for a few years.
If you find anything that you feel is incorrect, please feel free to leave a comment, and discuss your thoughts.
Fatal flaw
I was talking to a financial products sales person today, trying to sell me on a variable universal life insurance. Essentially, money put in is invested in some stocks of my choice, and grows completely tax free. Withdrawals are tax free, and on top of everything, there is a life insurance component.
They made a really good case — on paper, the product outperforms a traditional brokerage account, assuming you hold the same stocks in both, due to the tax advantage, which generally out shadows the insurance premiums. However, it has a (literally) fatal flaw — in order to completely withdraw everything from the account tax free, I’ll need to die.
Wait… what?!
My understanding is that the insurance component of the product is what keeps the withdrawals tax free. If I take out all the money before I die (i.e.: cancel the life insurance), then all the gains are immediately taxable. So, while on paper, after 8 years of contributing $100k per year, I can withdraw up to $4m from the policy after 30 years, with a $7.1m death benefit, in practice, I can really only take out $3.2m — taking out any more will risk leaving too little to fund the insurance premiums, which then triggers taxes on the withdrawn amount.
Now, if I had just dumped that same amount of cash into SPY, and held for the same 30 years, I’d have $4.9m before taxes. Selling everything and paying taxes, will leave me with about $3.5m. Cash.
So, while on paper, my net worth is $4m/7.1m (depending on whether I live), in practice, I can really only access $3.2m, which is quite a bit less than just buying SPY.
You cannot eat net worth
The thing most people get confused by, is the number on their “balance sheet” indicating their net worth. But net worth isn’t the whole story. To put it bluntly, you cannot eat net worth. Having a net worth of $100m is completely useless unless you can liquidate that net worth to get actual cash, with which to actually buy stuff.
And that’s where it gets complicated — not all net worth are created equal. As we discussed in Zero sum game, it is very easy to manipulate numbers to make your net worth essentially say whatever you want. Heck, if you want, I will give you $10m — I have a piece of paper here, on which I’ll write “So-and-so has $10m… as long as they agree never to ever withdraw that money”. Congrats on being a multi-millionaire.
Another case where not all net worth are equal is taxes. Let’s say Alex bought 1,000 shares of a company that pays no dividend 20 years ago at $1 per share. That stock is now worth $1,000, so on paper, Alex has $1m. Compared to Blair who, literally, just has $1m sitting in the bank. Some may think that both Alex and Blair are equally rich. But are they really?
If Alex wants to buy anything, they will have to liquidate some of the shares, which then triggers capital gains taxes. Taking out the capital gains taxes will leave Alex with quite a bit less than $1m. Blair, on the other hand, has $1m completely free and clear.
Net worth is useless?
Not quite. Net worth is still useful, as long as you can liquidate it easily. What you are doing when you liquidate your assets (i.e.: net worth) is literally to create cash flow. Cash flow which can then be used to buy stuff you actually do need, like, you know, food.
So while net worth is weird and funky in all sorts of unintuitive ways, cash flow, particularly after tax cash flow, is fairly simple to understand — if you have $1,000 in after tax cash flow, spending more than $1,000 means you’ll become poorer, and spending less than $1,000 means you’ll become richer, over time. Simple as.
Like the story in Zero sum game, we need to always keep in mind the distinction between stock and flow. Net worth, being a stock metric, is always subject to the whims of the market. If the market decides that your assets are worth $500 instead of $1,000 today, well, you just lost half your net worth. But flow is stable — a dollar is a dollar is a dollar (1).
So, given a choice, I’d rather have a guaranteed $500k of cash flow every year (indexed to inflation), than $10m of assets that I cannot sell (also indexed to inflation) — If you have $500k of cash flow every year, you pretty much can ignore your net worth and still live a very comfortable life. But having a, say, unsellable diamond worth $10m is really only useful if you eat diamonds for breakfast. Or something.
Net worth vs cash flow
In reality, net worth and cash flow are tied. (Hopefully) nobody is dumb enough to put all their money into illiquid assets with no cash flow. Instead, most people invest in either liquid assets (stocks, bonds, etc.) or illiquid assets with cash flow (real estate, private businesses, etc.). So in most cases, having a higher net worth means a higher cash flow, and vice versa.
The thing to keep in mind is, again, “you cannot eat net worth”. It’s all fine and well to have a high net worth, but if you like eating, or having a roof over your head (2), you need to figure out the cash flow picture.
And then what?
All these tie back to 3 words I ask a lot when someone shows me their latest highly levered bets on various speculative assets — and then what?
In all of these cases, the person has money in some levered asset that, for whatever reasons, has done well recently. On paper, they are doing pretty well.
That’s great! But unless you think that asset will continue to do well (or at least maintain its value) up until the point you need cash in the future (20, 30, 40 years from now when you retire?), the thing you need to ask yourself is… and then what?
Are you going to sell and buy something with a stable cash flow?
Are you going to keep the money in that asset and pray that it’s not just a temporary spike and everything will just disappear tomorrow?
Are you going to sell and keep everything in cash?
Recall that speculation is a zero sum game. At some point, somebody will have to eat a loss if somebody else made a gain. Which of the 2 somebodies are you gonna be in the future?
Footnotes
OK, not quite. Dollars (and all fiat currencies) tend to depreciate over time due to inflation. But that’s more of a long term thing compared to the short term issues we are discussing here.
Admittedly this is anecdotal — I like to eat on a regular basis and have a roof over my head. You are, of course, free to pursue your own preferences.
I’ve been receiving a bunch of correspondences from various folks boasting about their (or their acquaintances’) trading prowess. In almost every case, these are folks who haven’t really been trading that long, or at least, their success hasn’t really materialized until the last few trades.
That concerns me, because the first thing you learn in quantitative finance (i.e.: quant trading), is that you need to be able to separate skill from luck. Lying to yourself rarely ends well.
FWIW, I believe that it is possible for individuals to do well (risk adjusted) in the market, and consistently. But it’s hard enough that for the most part, most people shouldn’t try.
As usual, a reminder that I am not a financial professional by training — I am a software engineer by training, and by trade. The following is based on my personal understanding, which is gained through self-study and working in finance for a few years.
If you find anything that you feel is incorrect, please feel free to leave a comment, and discuss your thoughts.
It’s good to be great, it’s better to be lucky
Most people don’t seem to realize that it is extremely easy to be lucky.
Quite a few of my friends know this(1) — my best trade was a ~40x return in about 3 days. It was my first ever options trade, I had no clue what I was doing, but I turned ~$200 into ~$8,000 before the end of the week.
That doesn’t mean I’m smart, successful or even had any clue what I was doing. It just meant I was lucky.
But nobody (other than my wife) knows this next part: My next few trades were also winners. None got close to the 40x in 3 days metric, but most of them did pretty well (30-50% gains in a few hours/days). In all the trades, I correctly called for gold/silver to go up, and I was just trading in and out of short term calls on GLD and SLV — the 40x was a 7DTE call on SLV.
All these mean nothing. This entire episode happened during April of 2011 — I thought gold/silver would go up, because I read an article that said gold/silver would go up. And like an idiot, I believed it without question. That’s all.
I didn’t know it at the time, but the author of the article had been writing about gold/silver going up for years. They would go on to continue writing about gold/silver going up pretty much all the way up to today. Other than for that ~2 weeks when I started reading their work, they were basically always wrong.
Yet I made a ton of money (percentage-wise) in a very short period of time. Ergo, not genius, just pure, dumb luck.
Winning consistently vs winning big
Another thing that people don’t think very much about is consistency vs absolute magnitude.
The absolute return you make from a few trades means almost nothing in terms of how good you are. For reference, see the 40x gains I had above.
Instead, it is the ability to consistently do well that is a hallmark of those who really and truly know what they are doing.
Given that market/business cycles take around 8-12 years, at a minimum, if you want to prove that you are “good”, you’ll need to at least be outperforming the market by around a decade or more. This shows that you can outperform in any stage of a cycle, and not just be good at buying levered products (SSO, UPRO, etc.) during a bull market.
Finally, mathematically, ~10 years is also a decent measure — assuming any active trader has a 50/50 chance of outperforming the market, then being able to outperform over a 10 years period means they are 1 in a thousand (2), which gives some confidence and credibility towards their claim of greatness.
Diamond in the rough
So, if you come to me showing the latest 30% gain you make in a single trade, know that:
I am happy for you. Really. The curt tone is probably just because I’m jealous.
I can’t tell if you are good or just lucky, and given that most people fall in the latter bucket, I’m just gonna stick with the default option.
This doesn’t necessarily mean you’re not good. It just means you haven’t earned it yet.
Footnotes
I typically use the story above as a way to warn others when they seem to be overly sure of their prowess.
This is a quick note, which tends to be just off the cuff thoughts/ideas that look at current market situations, and to try to encourage some discussions.
As usual, a reminder that I am not a financial professional by training — I am a software engineer by training, and by trade. The following is based on my personal understanding, which is gained through self-study and working in finance for a few years.
If you find anything that you feel is incorrect, please feel free to leave a comment, and discuss your thoughts.
Covid-19 strikes back
Since around early July, stocks have been trading mostly sideways with a slight downward bias in the previous week. Yesterday (7/19), stocks took a ~1.5% dive, while volatility, as measured by the VIX, peaked at over 24 from a sleepy sub-18 print last Friday. This decidedly reddish hue of green caused a bit of a stir, especially since it is hitting in the middle of summer, a period traditionally marked by quiet markets as traders are busy with their vacations.
The financial news media is abuzz with suggestions that a rise in Covid-19 cases, this time by the delta variant, is to blame. Multiple countries are seeing an uptick in Covid-19 cases, with the UK especially apparent — cases in the UK are at 70% of all time highs (around 48k cases/day, compared to around 68k/day at the highs), and appears on track to take out the highs in a week or two. UK health officials and media are flirting with the idea of lockdown again, though Boris Johnson did not relent, with Freedom Day finally arriving yesterday.
The rise of the vaccinated
Despite the seemingly grim news, there is a ray of hope. While cases have been rising, death toll from Covid-19 has been surprisingly muted:
UK daily Covid-19 cases and deaths, courtesy of Google.
Some have speculated that this is due to the high rate of vaccination in the UK (at 70% of the population having at least one dose, it’s one of the highest in the world), while others have suggested that better treatments available, now that doctors and researchers have had more time and experience. Regardless, based only on the UK’s numbers in the past 7 days, the current death rate (1) for Covid-19 is lower than that for the flu (2).
A few random countries I picked show similar trends (cases up but deaths down) or better (cases and deaths both down). None of the 10 or so countries I randomly tried saw increasing death rate (as a ratio of case count).
So, unless that death rate suddenly spikes dramatically (3), it seems like the market may be overreacting slightly, assuming their only concern is the rise of Covid-19.
The cyber menace
If only that was the only thing we need to worry about. Over the weekend, a report came out suggesting that some of the major cyber attacks on US soil (4) in recent memory had links to China. President Biden made it official yesterday in an official White House press release, and the statement was backed by a few American allies.
Perhaps I’m still suffering from PTSD (5) due to the trade war of 2018, but this has undertones of a time when I’d rather not revisit, especially in light of the recent tensions due to big tech regulations, human rights, etc.
Hopefully a peaceful diplomatic solution can be found, but at least in the short term, it’s another thing to think about.
The last meme
Something that I’ve prognosticated on since last July (6), was the return of normalcy. The thesis being that with everyone cooped up at home, there is a natural draw towards more retail trading, but with reopening (7), “other stuff” will naturally take up our time, which should reduce retail trading volumes. And if retail traders were mainly the culprits bidding up markets (specifically meme stocks), then a lack thereof of such may portend dark tidings.
So far, this is sort of happening — meme stocks hit a crescendo in February/March and have been mostly leaking lower ever since.
Finally, with the end of fiscal support, especially the eviction/foreclosure moratorium, around the end of July, the impetus is there for more folks to hunt just a little bit harder for their next job, and recent joblessness numbers are reflecting that.
And well, it’s just harder to day trade meme stock options when you’re working, y’know?
Attack of the karma
Of course, now that I’ve typed this all out (despite the tone and date of the post, I’m actually typing this on the evening of July 19), you can bet that the markets will open (7/20) green and make new all time highs before lunch (8).
Because. Just because.
Footnotes
This is not a perfect measure — deaths are strictly a “lagging” indicator, while a non-trivial number of people are probably misclassified either way (died from Covid-19 labelled as died from other causes and vice versa). At the same time, there’s probably a good number of people who are infected but are not captured by official statistics for various reasons.
It might! Again, deaths necessarily lag infections.
Can you actually say a cyber attack is on “US soil”? Seems kinda weird?
I happen to be trading FX algorithmically in 2018, and well, you always trade FX with leverage. Huge amounts of leverage. Makes for very unpleasant blood pressure graphs whenever ex-President Trump tweets anything about the trade war.
If your predictions don’t come true, try, try again. Eventually they will come true. Or everyone will have died of old age and nobody will remember anyway.
Remember folks predicting that we’d be reopening in July… 2020?
Absolutely not investment advice. Though if you do bet on it and made money, you’re welcome. 🙂
There are some who think that stocks are gambling, that trading stocks is, essentially, a zero sum game. In some sense, they are right, but the truth is more nuanced than that.
How do we reconcile the idea that trading stocks are a zero sum game, with the very real fact that a non-trivial number of financial fiduciaries encourage their clients to invest in stocks?
Can you even “invest” in something that is a zero sum game?
As usual, a reminder that I am not a financial professional by training — I am a software engineer by training, and by trade. The following is based on my personal understanding, which is gained through self-study and working in finance for a few years.
If you find anything that you feel is incorrect, please feel free to leave a comment, and discuss your thoughts.
Flip flopping
Let’s say we have 2 buddies, Alex and Blair. They each have $1,000 as they begin their journey:
Total Cash (dollars)
Total Assets (units)
Asset value (dollars)
Debt (dollars)
Net Worth (dollars)
Alex
$1,000
0
$0
$0
$1,000
Blair
$1,000
0
$0
$0
$1,000
Now, let’s say they have a brilliant idea(1) — they’ll create a brand new asset, let’s call it Kelpie, and they have a brilliant, fool-proof way to get rich, together. First, Alex starts with 100 Kelpies, conjured out of thin air, and they will value it at $1 each.
Total Cash (dollars)
Total Assets (units)
Asset value (dollars)
Debt (dollars)
Net Worth (dollars)
Alex
$1,000
100
$100
$0
$1,100
Blair
$1,000
0
$0
$0
$1,000
Price of 1 Kelpie: $1
Voila, our two friends, combined, are now $100 richer. But they have grander plans than that! Alex next sells 50 Kelpies to Blair at $1.10 each. The “market value” of each Kelpie is now $1.10.
Total Cash (dollars)
Total Assets (units)
Asset value (dollars)
Debt (dollars)
Net Worth (dollars)
Alex
$1,055
50
$55
$0
$1,110
Blair
$945
50
$55
$0
$1,000
Price of 1 Kelpie: $1.10
Now, our two friends are, combined, $10 richer — Blair is still worth $1,000, but Alex made another $10. Well, this is a mutually beneficial relationship, and so far, only Alex is making hay. To make it up to Blair, Blair now sells 10 Kelpies to Alex, at the princely price of $2 each.
Total Cash (dollars)
Total Assets (units)
Asset value (dollars)
Debt (dollars)
Net Worth (dollars)
Alex
$1,035
60
$120
$0
$1,155
Blair
$965
40
$80
$0
$1,045
Price of 1 Kelpie: $2
Notice how both Blair and Alex are now worth more than their initial $1,000. More interestingly, even though Alex bought Kelpies from Blair at a much higher price than when they sold it to Blair, Alex actually “made” $45! I think we have a winner here!
Alex and Blair continue trading between themselves, with Kelpies trading at higher and higher prices. Eventually, we hit this state, where Kelpies are $100 each:
Total Cash (dollars)
Total Assets (units)
Asset value (dollars)
Debt (dollars)
Net Worth (dollars)
Alex
$2,000
20
$2,000
$0
$4,000
Blair
$0
80
$8,000
$0
$8,000
Price of 1 Kelpie: $100
Now, we have a problem. Blair is supposed to buy Kelpies from Alex this round, but they are out of cash! That’s fine, Blair takes out a loan of $1,000 against their “assets” of $8,000 — that’s only a 12.5% loan-to-value (LTV), which is generally considered “safe” by most banks. Blair then use the newly acquired cash to buy more Kelpies from Alex at $200 each.
Total Cash (dollars)
Total Assets (units)
Asset value (dollars)
Debt (dollars)
Net Worth (dollars)
Alex
$3,000
15
$3,000
$0
$6,000
Blair
$0
85
$17,000
$1,000
$16,000
Price of 1 Kelpie: $200
Notice how Blair’s net worth doubled, despite taking out a loan, and spending cash to buy Kelpies.
Our two friends continues trading Kelpies between themselves, taking out loans if needed if one of them runs out of cash when it’s their turn to buy. By trading Kelpies back and forth, both of them managed to greatly improve upon their net worth. Their last trade has Kelpies valued at $1,000 each. Houston, we have liftoff!
Total Cash (dollars)
Total Assets (units)
Asset value
Debt (dollars)
Net Worth (dollars)
Alex
$10,000
40
$40,000
$5,000
$45,000
Blair
$2,000
60
$60,000
$5,000
$57,000
Price of 1 Kelpie: $1,000
Car shopping
At some point, Blair decides they want to buy a new car. And since they are rich now, only a fancy car will do — a fancy car that costs $50,000. It’s going to hit their net worth hard, but what the hell, you only live once! Besides, Blair has found the secret infinite money cheat to life!
Unfortunately, the car dealership won’t take Kelpies (they simply do not see the transformative nature of Kelpies), and they want cash instead. So Blair went to Alex, and asks (nicely) if Alex would buy some Kelpies from Blair at, say, $1,100 each, so that Blair can raise $50,000 for the new car. However, Alex does not have the cash, and is unwilling to take out such a huge loan.
That’s OK — they have on their hands a transformative asset, that is rising in price faster than inflation. Everybody trading this asset has agreed that it can only go higher, and will never sell at a lower price. So it seems only natural that they should spread this gospel to the world, and lift millions out of poverty!
Alex and Blair approach Cameron, their mutual friend, and fortunately, someone already rather wealthy. They persuaded Cameron to buy some Kelpies from Blair, at $1,500 each:
Total Cash (dollars)
Total Assets (units)
Asset value
Debt (dollars)
Net Worth (dollars)
Alex
$10,000
40
$60,000
$5,000
$65,000
Blair
$54,500
25
$37,500
$5,000
$87,000
Cameron
$0
35
$52,500
$0
$52,500
Price of 1 Kelpie: $1,500
Blair then takes $50,000 and buys the new car.
Total Cash (dollars)
Total Assets (units)
Asset value
Debt (dollars)
Net Worth (dollars)
Alex
$10,000
40
$60,000
$5,000
$65,000
Blair
$4,500
25
$37,500
$5,000
$37,000
Cameron
$0
35
$52,500
$0
$52,500
Price of 1 Kelpie: $1,500
Reality bites
To celebrate their new found wealth, the 3 friends decide to take a road trip in Blair’s fancy new car. Unfortunately, they got into an accident, and were all seriously injured. The medical bill came out to $12,000 for each of the friends.
No problem, they thought — all 3 friends are much richer than that, and can easily afford it.
The friends offered Kelpies to the hospital for their bills, but the hospital politely declined. As with the car dealership, the hospital simply did not have the foresight to see the transformative nature of Kelpies, and instead, demanded cash. Well, now we have a problem — our friends are asset rich, but cash poor.
Alex quickly realized that they really only need another $2,000 to cover the bills. So with deep regret, Alex offers to sell 2 of their Kelpies at the previous price of $1,500 to Blair. Alex was previously planning to sell only when Kelpies hit $3,000, so Blair is really getting a good deal here!
Blair looked at their holdings, and at the medical bill, and came up with another idea. How about, Blair sells Alex 8 of their Kelpies, at the unbelievably great deal of $1,200? This will give Blair enough cash to pay their bills, and still have $2,100 left over. And Alex got to buy Kelpies at the fantastic price of $1,200!
Cameron, too, looked at their holdings, and at the medical bill and came up with another even better idea. How about Cameron sells Alex 8 Kelpies for only $1,000 each ($200 cheaper than Blair!), and then another 4 Kelpies to Blair at the same price? That’ll give Cameron enough cash to pay the bill, and both Alex and Blair will get a GREAT DEAL!
This goes on for a while, until eventually, the friends realize, that between the 3 of them, there really is only enough cash to cover one person’s medical bills, and no amount of trading or discounting will change that fact. Also, collectively, they are now $10,000 in debt.
Stock vs flow
As alluded to in Investing vs Speculating, purely trading/speculating is a zero sum game. In our little story, the entire “market” only ever had the actual value that the friends themselves put in. Before Cameron joined the game, there was only ever $2,000 (net of debt), which was why despite their lofty “net worth”, Blair was not able to buy the car without the cash infusion from Cameron.
There never was the grandiose “value” that our friends made up in their minds, it was only ever “paper gains”, and our friends committed the sin of confusing stock with flow.
Flow – The transactions at the margin of the market
Stock – The totality of all assets in the market
Our friends thought that just because there was flow, and that the flow was consistently valuing Kelpies at a higher price, that, therefore, their stock of existing Kelpie was worth as much. This quickly breaks down, when the liquidity needs of the market participants exceeds the available flow in the market. And when that need for liquidity emerges, the phrase “prices are set at the margins” quickly became apparent.
Zero sum game?
Kelpie was just a analog for a stock, right? So, are stocks a zero sum game?
No, and no.
Kelpie is an analog for any asset that can be traded, not just stocks. This means, stocks, gold, bonds, houses, cars, bread, art, etc. Everything that can be traded. But no, that does not mean stocks (or any of the other assets listed) are zero sum games.
Remember that stocks represent fractional ownership of actual businesses. Assuming the business is performing well, it will generate profits. Even if the profits are not distributed to the shareholders, the profits exist somewhere. Unless there is fraud, that somewhere is generally “the books of the company”. This means that if Kelpie was a business, then the 3 friends could have just found another entity to buy the business from them. If the business is run well, and is profitable, it shouldn’t be hard to find some entity willing to pay for the business, although possibly at a discount — the 3 friends are desperately in need of liquidity, and thus have less leverage in making the deal with the buying entity.
In effect, a productive asset, like a stock (or bond) periodically injects the value of their production into the system, which means the entire system is a positive sum game.
For other assets, like cars and bread, which have intrinsic values (people want the car/bread, because both have attributes that are desirable), there is a natural floor to how low the prices of the assets will go. Yes, in a firesale, where the seller is desperate for liquidity, they may sell the asset for less than intrinsic value. But if the seller has enough time to shop around for buyers, they will likely be able to get fairly close to intrinsic value at least. This also means that if someone bought an asset with intrinsic value at a price higher than its intrinsic value, they stand a higher chance of losing money — unless they can find a greater fool to pay an even higher price, they will be forced to sell at intrinsic value, at a loss.
In effect, for non-productive assets, trading is basically a zero sum game — without the constant injection of value from production, the net of all trading will be $0. That said, assets with intrinsic value at least have a price floor. Assets with no intrinsic value, like our original Kelpie, will likely go to nothing eventually (technically, they revert to their intrinsic value of $0).
Productive assets at any price?
Let’s consider a stock that represents fractional ownership of a business.
At an instance in time, where the business already has some amount of assets on its books, and also has the potential to generate future profits, we are able to value the assets currently on its books, and as well as to provide an approximate value for the future profits (see the How To Value A Company series for discussions on how to value a company).
In some sense, at a specific moment in time, we can say that a business has a fixed intrinsic value, and we can treat the business as essentially non-productive, at that instance in time.
Which means that yes, like with regular non-productive assets, it is possible to overpay for a business (i.e.: stock).
The net amount of gains and losses, from all investors of [a business], across all time, based only on [the business], will be exactly equal in dollar value to the sum of all earnings of [the business].
So, you can consider trading stocks as both investing and speculating. Part of the profits from trading stocks will come from the productive part of the business (i.e.: investing), and part of the profits will come from just selling to a greater fool (i.e.: speculating).
Now, consider the P/E ratio of a company — it is the price of the company, divided by its earnings (i.e.: profits (2)). In effect, the P/E ratio is how much you pay for each dollar of profits from that company.
Remember how profits are injected into the system for productive assets, leading to positive sum games?
Let’s say we have a company with a P/E ratio of 1, i.e.: investors pay $1 for each $1 of earnings.
Every year, an equal amount of value is injected into the system as the value of the stocks. In this extreme case, the productive nature of the asset is very significant to the trading — it represents 100% of the stock value of the asset every year! In effect, if we have $1m of stock value, then every year another $1m of productive value is injected by the business, pushing our zero sum game to a sum of +100% per year.
Now, let’s consider a company with a P/E ratio of 1,000, i.e.: investors pay $1,000 for each $1 of earnings.
Every year, only 0.1% (1/1000) of stock value is injected into the system by the production of the business. In this extreme case, the productive nature of the asset is almost a rounding error — it pushes the trading from zero sum to sum of +0.1% every year.
So, the larger the P/E ratio(3), the most speculative, and more “zero sum game”y the asset.
Final words
As with our 3 friends, in the heat of the moment, when our paper net worth is rising quickly for what seems like doing nothing, it is easy to convince ourselves that we are geniuses, that we have discovered “the secret to wealth”, or that the asset(s) we are investing in has intrinsic value — who wouldn’t want to own an asset whose price is going to the moon?
But remember that unless the asset has productive value, in an emergency, when you desperately need liquidity, it may be hard to sell the asset for anything more than intrinsic value. And intrinsic value may be a lot lower than whatever price you personally paid.
It may help to think of “the asset” as “a $1 bill”. Yes, if you have a $1 bill that, for whatever reason, is desirable (maybe it was handled by some famous celebrity), you may be able to sell it to a speculator for more than $1. But the universe of people who are wiling to pay more than $1 for a $1 bill is relatively small — not everyone cares about the provenance of their cash. So the latest owner of that $1 bill, may find that in an emergency, they can really only use that $1 bill as… a $1 bill — even if they paid $100 for its provenance. In effect, that $100 “intrinsic value” applies only to a niche market, and the broader market simply does not care, and unless you can find someone else from that niche market, you are stuck with the broader market’s intrinsic value of $1.
Footnotes
For the purposes of this illustration, we are going to ignore the legality of the things discussed. Some of the things discussed here are in the legal gray area (some may be outright illegal!), so please, do not try this at home.
Earnings/profits mean something very specific in finance/accounting. Technically, the usage here is not quite correct, but it’s close enough. See How to value a company – income statement for details.
This is an oversimplified explanation. In reality, businesses grow — just because a business generates $100 in profits this year, doesn’t mean it’ll only generate $100 in profits the next year. A company with growing profits and static stock price, will naturally see a P/E ratio that shrinks with time. In effect, P/E ratio is a static, snapshot in time, valuation metric, that does not capture the dynamic nature of businesses over time.
This is a quick note, which tends to be just off the cuff thoughts/ideas that look at current market situations, and to try to encourage some discussions.
As usual, a reminder that I am not a financial professional by training — I am a software engineer by training, and by trade. The following is based on my personal understanding, which is gained through self-study and working in finance for a few years.
If you find anything that you feel is incorrect, please feel free to leave a comment, and discuss your thoughts.
Tethered
Around the start of 2021, the “market cap” (1) of Tether (2) started increasing at a phenomenal rate. In the first month of 2021, it grew by about 25%, then 35% in February, but “only” 14% in March. April saw another 25% spurt of growth, but May and June, together, saw “only” a 22% growth, with most of the growth in May and June mostly flat, with even a slight dip in late June.
Prior to around late 2020, the crypto space was mostly the playground of more libertarian minded folks, and for the most part, ignored by most large institutional entities.
However, around late 2020, and especially in early 2021, a few large institutional players started taking note of crypto, and initiated positions in the space. The reverse is also true — the provider of Tether claims that the majority of its assets were held in more traditional financial instruments, such as commercial paper (i.e.: short term corporate debt), corporate bonds (i.e.: longer term corporate debt), funds, etc.
So — Tether is “backed” (3) by corporate debt, while some (possibly same, possibly different) corporations have crypto on their balance sheets, and finally, Tether is part of many conversion pathways between many crypto coins and fiat currencies (4).
Leverage
There is anecdotal evidence to suggest that Tether is involved in a bunch of highly leveraged (5) crypto trades, and the increased use of Tether may be a symptom of the increase in leverage in crypto in general. Note that Tether is hardly the only stablecoin — there are a ton of these currently operating, mostly tied to the US dollar, though some are tied to other fiat currencies.
Some firms issuing bonds (i.e.: debt) to buy crypto coins.
At the same time, some crypto coins (not necessarily the same coins as the ones above) are backed by corporate bonds (again, not necessarily the same as the bonds above).
Even though the coins/bonds in both those statements need not be the same coins/bonds, there will likely be some form of linkage, albeit potentially tenuous. For example, bond funds and algorithmic trading firms (i.e.: quant hedge funds) tend to lump individual corporate bonds into groups, and then trade everything in the same group as basically interchangeable.
Thirty thousand dollars under the C(oin)
Currently, Bitcoin is trading at around 31 thousand dollars, having repeatedly tested the 30-31 thousand range recently, and more broadly (since mid April) grinding downwards. Given that Bitcoin started the year just below 30 thousand dollars, almost everyone who bought bitcoin in 2021 is underwater on their 2021 purchases.
Get to the damn point
All the above is basically just a “quick” introduction to the space, and to make the following points:
Many institutions initiated crypto positions in 2021.
Bitcoin, by far the most popular crypto coin (6), is basically flat on the year. (7)
There is a lot of leverage in crypto.
There are non-trivial and often non-obvious linkages between cryptos and more traditional financial assets.
Given the above, it seems to me, that if bitcoin were to fall decisively below around the 29 thousand dollars mark (a drop of around 7%), and stay there for more than a few days, there is a decent chance that a few of the institutions may sell (or be forced to sell, due to being overly leveraged), resulting in a cascade of selling between the linked assets, as over levered players are forced to unwind.
Which is the nice way of saying “contagion”.
It probably won’t be terrible. Despite the large numbers involved in crypto, which dwarves the numbers we saw during the Great Financial Crisis of 2008, many players in the crypto space are relatively price insensitive, and many bought in before the 2020/2021 run up in crypto prices, so they may not even be underwater.
So while there may be pain (and very intense pain at that) in the linked assets during the unwinding of leverage, it probably (hopefully!) won’t result in financial armageddon like in 2008, i.e.: the pain will probably (really, really hopefully) be contained to the linked assets.
That said, it’s not clear to me that if (and that’s a very big if) such an unwind were to occur, whether the prices will quickly return to their pre-unwind values, or if they’d languish around or even go down more.
I guess we’ll just have to wait and see.
Footnotes
More accurately, the spot value of all outstanding Tether coins.
Tether is a stablecoin, a type of crypto coin whose value is supposed to be tied to fiat currencies like the US dollar.
More than a few financial analysts have questioned the Tether disclosures, since those numbers would make Tether one of the largest holders of corporate debt instruments. Yet prior to these disclosures, almost no large bank/analyst firm had Tether on their radar, which is rare. It’s possible, but unlikely.
Many crypto brokerages actually do not trade in fiat — they may not have the proper licenses with the relevant regulators. Instead, they trade only in stablecoins (i.e.: you are buying a stablecoin when you sell another crypto, and selling a stablecoin to buy another crypto). This isn’t always obvious to the end user, because these brokerages sometimes represent the trading as being against fiat currencies. One recent example is El Salvador’s law making bitcoin legal tender — users put in US dollars, which are then immediately converted into Tether, which is then used to buy the bitcoins.
I guess “highly leveraged” is a matter of perspectives. Traditional stock trading only allows 2x leverage, but crypto trading tends to allow for much more, e.g.: Kraken, Binance, etc.
Almost all institutions speculating in crypto coins are only in bitcoin, since it has the most liquidity, and is the most recognized.
In the crypto space, anything less than a 10% move over a few months is basically “flat”.
Opinions are like rear ends — everyone has one, and most of them smell funny. Analyst reports are just formal versions of opinions. Draw your own conclusions.
I want to start by noting that I am not a financial professional by training — I am a software engineer by training, and by trade. The following is based on my personal understanding, via some formal classes, but mostly self-taught.
If you find anything that you feel is incorrect, please feel free to leave a comment, and discuss your thoughts.
What report now?
The definition of an “analyst report” is a little loose — people have been talking about stocks pretty much since people have been trading stocks. Anyone who claims to be able to predict the movements of stocks will always get an audience.
To keep the discussions sane, when I say “analyst report”, I mean “analyst reports, valuation models and other stuff of this nature”. Essentially, any document (or video!) that tries to decipher the threads of Fate and give you an insight on what a stock’s price would be in the future.
Types of report
Analyst reports come in 3 main flavors – sell side reports, buy side reports and independent reports.
Sell side reports are the reports that banks, brokers, dealers, etc. generate. These are entities that generally are not investing in the stocks, but provide a service to help someone else (their clients) buy or sell stocks.
Buy side reports are the reports that hedge fund managers, private equity managers, endowment fund managers, private investors, etc. generate. These are entities that are investing in the stocks themselves, or are managing money for others who are investing.
The main difference between brokers/dealers and “money managers” in this, is that “money managers” (buy side) have “skin in the game” — if their recommendation do well, they tend to profit, and if it does not, they may lose money. Brokers/dealers (sell side), on the other hand, are generally just interested in encouraging trading activity — they collect a fee based on each trade, and have no further “skin in the game”, regardless of how the stock performs.
Independent reports are generated purely for the sake of the report. For example, independent research companies which generate reports, and then try to market and sell the reports themselves.
In terms of quality, independent reports tend to be the least biased, followed by buy side, followed by sell side.
Note: Everytime the market is moving rapidly, either up or down, there will be a rush of people trying to portray themselves as “gurus” of the stock market. Some of these people are legitimate — proper research operations with a team of researchers. Others are more fly-by-night operations with a single (or maybe husband+wife/family) operator, yet others are just thinly veiled buy side operations that are just touting their own stocks. The first may or may not produce good recommendations, but the latter two almost never so.
Why write these reports?
As hinted above, sell side reports are generally created as a means to encourage clients to trade more. For example, most brokerage firms will produce reports that provide basic information about a company, and provide historical charts of how the company’s stock price and various other metrics have performed. Some buy side reports also include projections or even recommendations on what stocks to buy and when.
The goal, ultimately, is to provide as much information as needed for the client to decide that they know enough to pull the trigger — to execute a trade. Remember, sell side earns their money from collecting fees (or spreads) when a trade happens, or by collecting fees for handling your account. If you don’t trade, and you don’t put money/assets with them, they don’t get paid.
Buy side reports, on the other hand, are generally private. They are generated as proprietary work products of large financial entities, or even your average investor! Many retail trader have some form of research report that they produce while trying to decide how to manage their money. This can be as simple as “TSLA to the moon!” scribbled on a piece of toilet paper, or as detailed as a spreadsheet with line by line breakdown of a company’s quarterly reports.
The buy side reports that generally make it to the public, usually are published with a single focus — to convince the rest of the world that they are right, and that the rest of the world should follow them in that trade.
Independent reports, finally, are usually made for sale. They tend to be more neutral in tone, and often, the goal of the report is to sell the report itself. For example, Morningstar, Motley Fool, Benzinga, Seeking Alpha all provide independently sourced reports for sale. (1)
Reading an analyst report
When you read an analyst report, you should keep in mind the main objective of the research author, as well as their competencies. As this blog clearly shows, anyone with a keyboard can put together a post. Whether that post is worth reading, is an entirely different matter!
For the most part, analyst reports are fine — they may be wrong (or right!), but they are “fine”. Which is to say — analyst reports are not always right. If you read a report in full, including all the little size 1 font wordings and maybe press the author for proper disclaimers/assumptions, you’ll quickly realize one thing:
All reports have a list of assumptions/caveats, that taken in full, will read something along the lines of, “This report is correct, assuming it is correct. It may also be wrong. Don’t sue us.”
Analyst reports are not meant to be crystal balls — they are not meant to be predictive. For the most part, they are meant to be persuasive. i.e: Given a set of assumptions, then one possibility is that “this” will happen, and you should believe me, because <reason>.
In many cases, the assumptions are simply “assuming what we saw in the past N months repeat in the next N months”. Which is “fine” — it’s a reasonable prior given no additional information, but it is not “right”, nor is it “predictive”.
When you read an analyst report, don’t just skip to the last line that says “stock X is worth $Y”. Because that line is, literally, the most useless line in the whole report.
That line bakes in the biases, prejudices and, frankly in many cases, dumb-posterior assumptions made by the author, along with whatever number/fact fudging they care to put in. Instead, read through the assumptions, and see if they make any sense. You need some amount of critical thinking, some background on the macro and micro environments, and potentially some research of your own.
Once you’re done with the assumptions, look at the model the author is building. There are many valuation models, but all of them have pros and cons. More importantly, not all models apply to all companies. For example, P/FCF is a very useful model for REITs, because of their tax structure, but P/E is completely useless (because a large part of “E” is reduced by depreciation, which isn’t a real cost for most real estate properties) (2).
Once you’ve done the above, there are a few ways to react to an analyst report:
Read more analyst reports.
Adjust their numbers that were based on wonky assumptions and/or model.
Assign a probability for each report to become true, based on what you understand about the macro/micro environment.
Then take a probability weighted average of all the adjusted results and use that result. For example, after reading 3 reports, and adjusting each for obvious errors, you get these predictions: Report 1: Stock @ $100 Report 2: Stock @ $90 Report 3: Stock @ $50 You give these reports the following probabilities of becoming true: Report 1: 50% Report 2: 40% Report 3: 10% And so, the weighted average is (100*0.5) + (90*0.4) + (50*0.1) = $91
Read more analyst reports.
Filter out those that are just plain batpoop crazy.
Of the rest, look at the inputs they use, and for each input, consider a reasonable conservative estimate across all reports (you can use the most conservative, or the 25%-tile or whatever, depending on how risk-averse you are).
Then recompute based on these numbers. For example, if you filter down to 3 reports that are reasonable, and all of these have stock price models based on some estimate of future sales and future production costs, then you can either take the median (or 25%-ile, or average, or whatever) estimate for each of future sales/costs. Plug these blended estimates into the model, and arrive at your own estimate for the stock price.
Read more analyst reports.
Use the reports to get a feel of what people “on the street” are thinking, because while a single report is probably noise, a bunch of them together may show a useful trend.
Build your own model.
Read the report as a work of fiction, just like Harry Potter. If you enjoy it, great. If not, maybe try Judy Moody instead.
Roll your eyes at yet-another-crazy-analyst-report, say something nice but vague so that whoever showed you the report, and is eagerly hopping up and down telling you about this “hot new opportunity” that is “sure to go to the moon”, will just leave you alone.
Start a thread in an obscure forum in a private company/blog, trying to explain that analyst reports are not meant to be prophetic, nor are they the threads of the Fates. And pray that enough will understand enough that they stop throwing money at terrible ideas based on even more terrible ideas.
Footnotes
This is not a recommendation nor endorsement for any of these services, or the quality of their reports. Also, note that some research branded as “independent” may have ulterior motives, such as illegal pump and dump schemes, trying to “talk the author’s book”, etc.
See the “How to value a company” series of posts for more details on valuation models:
This is a quick note, which tends to be just off the cuff thoughts/ideas that look at current market situations, and to try to encourage some discussions.
As usual, a reminder that I am not a financial professional by training — I am a software engineer by training, and by trade. The following is based on my personal understanding, which is gained through self-study and working in finance for a few years.
If you find anything that you feel is incorrect, please feel free to leave a comment, and discuss your thoughts.
Disclaimer
My usual stance is to not write about anything that can be construed as “investment advice”, because I’m simply not qualified to provide that to anyone. This post diverges slightly from that.
In this post, I talk a little bit about my thoughts on inflation, and how I would (and currently am) hedge for inflation. This is entirely my personal belief, and what I’m doing for my own portfolio. More importantly, I may change my mind at anytime, and I may or may not write about it, and may or may not otherwise notify you when I change my mind.
Please do your own research, and consider carefully what is right for your own personal situation. What is right for me, may not be right for you.
Janet Yellin’
Janet Yellen, the previous Federal Reserve Chair and current Treasury Secretary, just had a very interesting press conference. As opposed to the Federal Reserve, which has been steadfastly saying “inflation is transitory”, Yellen gave a much more nuanced take, and suggests that higher inflation, as high as 3%, may be acceptable to the government. Given that officially reported inflation in the US is somewhere between 0 and 2% for the past decade or so, that’s pretty big news — even a 1% increase in inflation can result in significantly higher prices over long periods of time — 0% compounded for 10 years results in prices that are exactly the same, 1% compounded for 10 years leads to a ~10% increase, 2% leads to ~22% increase, and 3% leads to ~34%.
There has already been considerable consternation in the markets about higher inflation, with a scare earlier this year leading to a ~12% sell off in QQQ, and some more risky stocks dropping as much as 50-60%. So yeah, everyone’s talking aboutinflation. Yellen making it official, doesn’t seem like it’s going to help sentiments.
How high is high
Generally speaking, I think of inflation as several buckets (all numbers per annum) (1):
Note that the range for each bucket generally increases as you go down the list. This is by design — historically, inflation tends to grow exponentially (or at least, at a polynomial rate), which with some hand-waving, sort of means it’s easier to get from 6% inflation to 8% inflation (a jump of 2%) than it is to get from 1.5% to 2% inflation (a jump of 0.5%). This is also why central banks tend to, or at least, used to, be very wary of inflation — beyond medium inflation, it becomes very easy for inflation to get out of hand very quickly. When that happens it becomes really, really hard to get inflation under control.
Transitory?
The next question is, is inflation transitory? And the answer is… yes. No. Maybe?
It depends on what you mean by “inflation”. Inflation just describes a phenomenon, and therefore, technically, is always with us — even deflation is basically just negative inflation. More accurately, I think the question is, “is higher than normal inflation transitory?” And the short answer is — I don’t know.
But if I were to guess, then I think that it is unlikely that the US gets to high inflation in the near term (say, next 1-3 years). And even if it did get to high inflation, it’ll probably be transitory (say, less than 1-2 quarters).
As for medium inflation (which is still higher than the normal 1-2% we’ve been seeing), I used to think that it’ll be transitory and maybe last at most 1-2 quarters. But recent events, and Yellen’s speech, changed my mind, and I think we may see it for maybe 4-5 quarters, possibly even up to 2 years. Most of this has to do with how the economy is not really returning to normal evenly, and certain sectors are facing severe supply issues.
What I am doing
Given that I don’t think high (much less very high/hyper inflation) are in the cards, then it seems unlikely that inflation will be so high that it causes severe distress to many businesses (Some yes; Many, probably [hopefully] not).
So the core thrust of my thinking is that selective investments in productive assets (i.e.: businesses) should work. The key question is, which sectors/industries?
Bare necessities
My thinking, again, personal opinion, may be wrong, is that basic goods and services will still be in demand. So things like
Housing
Consumer staples
Healthcare
Utilities(-like)
will be in demand. And to the extent that the businesses in these industries/sectors can keep their costs under control and adjust their prices to account for inflated input costs, they should do well (3). Maybe even better than other sectors/industries. In my mind, non-“bare necessities” like consumer discretionary may suffer for 2 reasons:
Higher inflation tends to sap savings and reduce disposal income, leading to cutbacks on non-essentials.
In the past ~12 months, we’ve already seen an explosion in discretionary spending, which is likely to end once the stimulus and its effects die down; Usually, these types of pent-up spending tends to just pull forward demand, which means forward demand should be reduced — you only need so many Peloton bikes.
So, for the near term, say 1-3 years, I’m guessing the above sectors/industries will do slightly better than the others (4).
Note that for housing, I’m particularly in favor of multi-family housing, since that’s generally the most cost-effective option for the budget conscious, and for utilities(-like), I’m favoring those that are not deemed “natural monopolies” and thus heavily regulated (to the point where they cannot easily raise prices to offset increasing costs).
Can I be wrong?
You should always, always, always assume that whatever financial analysis you read has a high chance to be wrong, either intentionally (the author is malicious) or unwittingly (the author is just wrong) — nobody can see the future.
That said, here are some risks, that I can think of, to my guesses above:
Currently, various forms of fiscal stimulus are ending. If the government extends or comes up with new stimulus, then the above will likely be horribly wrong.
Currently, the Federal Reserve’s official stance is no interest rate hikes, though they are going to start talking about it. If they dramatically pull forward the timeline of hikes, or dramatically push back the timeline of hikes (I’m guessing first hike to be around 2022 – 2023), then the above may be horribly wrong.
Currently, the pandemic is ending in most developed countries, and peaking in most developing countries. To the extent that reopening proceeds at a reasonable pace (say, full reopening by end 2022 in most/all developed countries), the above is probably fine. But if not, then the above may be very wrong.
Currently, I’m not yet a complete idiot. But if I were…
Footnotes
Note that these are my personal definitions, and not firm — the boundaries of the buckets move slightly if you ask me at different times. That said, I think most economists will come to buckets that’s roughly similar. Other than the hyperinflation bucket, there are no official definitions that I know of.
This is the official definition — 50% monthly inflation, so ~12,900% a year.
It is not a coincidence that most of the sectors/industries listed are more likely to have fixed costs, but variable prices.
Note that “slightly better” is relative. It doesn’t mean these sectors/industries will go up in value — if the entire market tanks 50%, if these sectors/industries only tank 49%, they’ll still have done “slightly better”.
Everyone’s scrambling to find the next big thing, so that they can be rich. But things don’t come out of thin air, they are borne of ideas, sometimes even great ideas, and it is these ideas, coupled with a vision and hard work that resulted in the thing.
But where do ideas come from? Well, for the most part, ideas come from nothing. So really, nothing is the root of all these.
What if, we can skip all the in-between steps and just get rich off nothing? Move over Knowledge Economy, and welcome the Nothing Economy.
As usual, a reminder that I am not a financial professional by training — I am a software engineer by training, and by trade. The following is based on my personal understanding, which is gained through self-study and working in finance for a few years.
If you find anything that you feel is incorrect, please feel free to leave a comment, and discuss your thoughts.
So someone sold a statue. It is, at the same time, an extremely unique statue, and yet a very common one, because it looks exactly like the statue in the picture above. No, not the statue of the man, but the statue between his palm and his face — nothing. Yet, it is also unique, in that well, that nothing was presented on a pedestal, and sold for $18,000 dollars. 18,000 cold, hard, American dollars.
Nobody has ever done that before. Usually when someone wants to sell you nothing for real money, they have the decency to lie to your face like, “I’m gonna sell you this car for $18,000.” Then they take your money, make up some excuse (“I really need the bathroom, must be the oysters!”), and you just never see them again. Nothing sold. Money changed hands, somebody is happy, everybody understood what happened.
Nobody has really outright told anyone they were selling them nothing for $18,000, and then taken their money, legally and with both parties happy. It’s just not done, there are etiquettes and all that. But someone just did it, and it is unique.
Now, I don’t want to go around besmirching the good name of great inventors and all that, much less inventors of a whole new field of economics/finance, but really, I think the artist did it wrong.
Now that they’ve sold the nothing (I mean, statue), they can’t very well sell it again. It’s not theirs anymore. You simply just can’t go around selling things you’ve already sold. That’ll be fraud. And fraud is bad.
So that means all these following tips I’m gonna throw out, will be completely useless to them. They cannot act on these marvelous tips. Too bad.
Tip 1: We must go deeper
Why stop at selling the nothing itself? All the cool kids know you have to NFT it (1). An NFT is just a reference to something. In this case, nothing. That makes it even more meta. An NFT that references something is always kinda iffy, what if that something is destroyed? Or lost? Or stolen? Then that NFT seems kinda pointless, no? Wrong, even.
But if the NFT references nothing… then, it’ll.. always do the right thing? It just reference nothing no matter what. If you got burglarized, and the burglars stole nothing, you won’t call the police — what would they do? (“Sir/Mdm, they stole nothing, so we’ll do nothing, and you’ll have recovered nothing, and everybody’s happy.” ) Instead, you’ll simply shrug, and replace your nothing with nothing, and you’ll be made whole (2), and your NFT still makes sense… kinda.
Now, because the NFT is just a reference to nothing, it’s not fraud to just churn out more of it (all pointing to nothing!), and then sell them. Imagine the merchandising deals you’ll make! Disney will be green with envy.
Tip 2: … and nothing is fireproof
Why stop at selling the nothing, or the NFT of nothing? Take the next step and just burn it, make a video of you burning it, and then sell an NFT of that video. Is your head spinning yet? That’s just called art. You just need to be better at art to understand this.
Now, normally, the “burn something” NFTs are always a little bit dangerous. Sometimes it just doesn’t work out you know? Like the statue in the picture above (yes, the man this time) — it doesn’t burn very well, I’d bet. It’s all stone and clay and stuff, and those things don’t burn. Stone and clay just don’t like to cooperate like that. And other times, they burn too well. Like, burst in flames and burn down the whole building well. That’s just inconvenient. So, after you make a great big announcement about a “burn something” NFT, either it doesn’t burn (fraud!), or it burns down your house (not fraud, but potentially painful). Dangerous.
But nothing? Man, nothing burns very well all the time. Nothing burns like thermite. Yet burning nothing will never burn down your house — nothing burns until there’s nothing left, and since there’s nothing left in the first place…
And most importantly, after you’ve burnt nothing, and even if you’ve burnt everything, you’ll still have nothing more to burn!
Folks, this is a sustainable, repeatable process. And to a businessman, that’s just the sound of money. Ka-ching!
Tip 3: Franchise, franchise, franchise
Ok, I lied earlier. This tip will work for the artist. I’m human too, I make mistakes.
Now, think of all the crime’y people trying to come up with ways of laundering their illicit cash. They go through all sorts of crazy schemes to make the money seem legitimate, and in the process they lose 50-70% of the cash due to transaction costs and taxes. But really, they should have just did what the artist did.
“This cash is not illicit! I worked hard for it! I am a financial speculator by trade, and this is the profit of my trading!” I’d imagine they’d say when the police comes knocking. “What do you trade in, sir/mdm?” the police will ask, and our crime’y folks will, with a perfectly straight face, say, “nothing. I trade nothing.”
So, the tip here is just to go big! Set up a whole business built on selling nothing! Then sell licenses to operate a similar businesses under the same trade name to others — franchise the hell out of this! I can already see the mob bosses lining up to get in on a piece of this action.
What goes around…
So, we have a financial system that is entirely backed by the “full faith and credit” of various governments, i.e.: fiat money. Basically, they are backed by nothing (tangible).
The crypto fans are upset about this, and so their response is to create a better system. One based on blockchain, and math, and backed by ideas. And well, long story short, backed by nothing (tangible).
And then someone used either the first nothing, or the second nothing, to buy the third nothing. Albeit, the third nothing comes with a fancy presentation, pedestal and all that.
So I guess they got a good deal?
Footnotes
Yes, I just used NFT as a verb. I’m cool like that.
Mathematicians will tell you that not all “nothings” are the same — some nothings are better than other nothings. But that’s just mathematicians being mathematicians — they just like to get in on a good joke and make a mess of it.


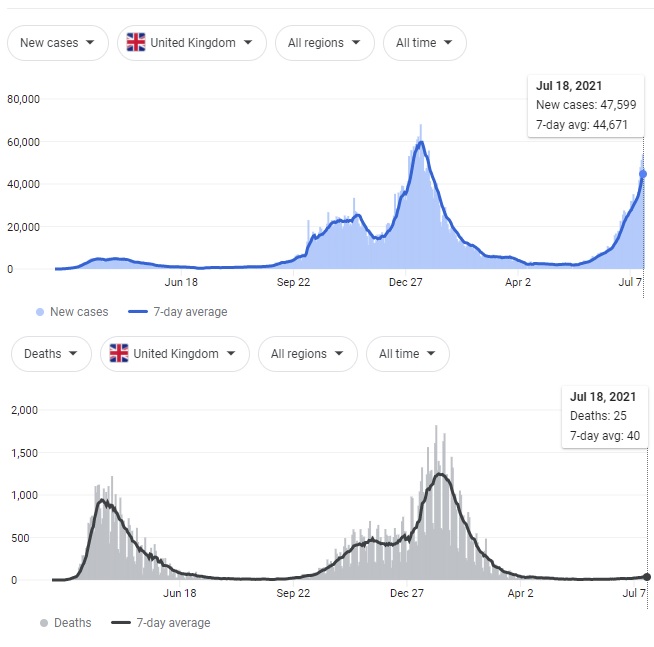
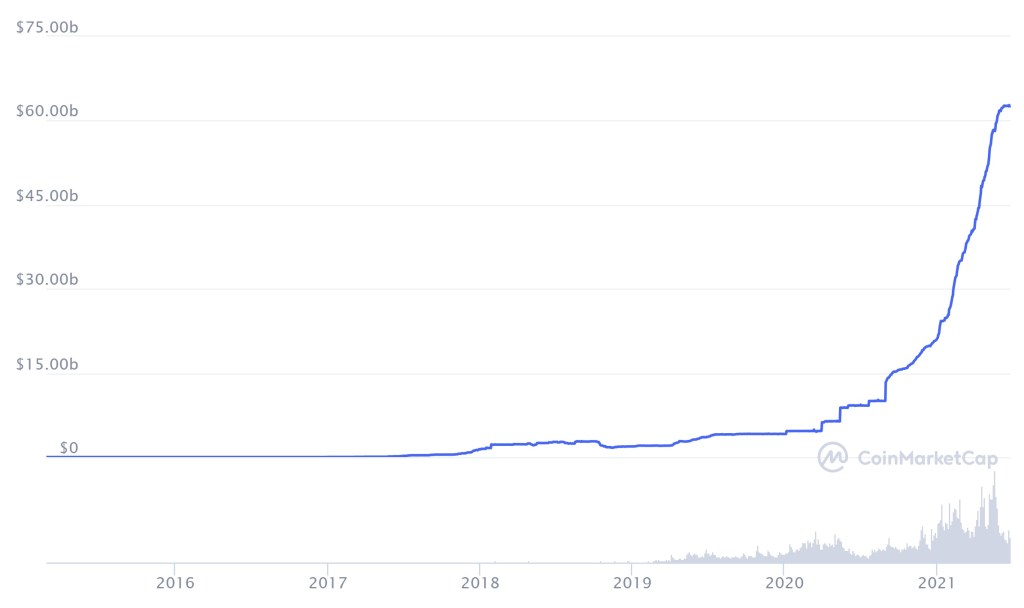

 Janky Thoughts