This is a quick note, which tends to be just off the cuff thoughts/ideas that look at current market situations, and to try to encourage some discussions.
As the ML/LLM capex boom expands ever larger, a useful exercise is to spend some time thinking about how large this can go, and when or what can potentially derail it. To that end, a post I came across recently puts a lot of things in perspective.
As usual, a reminder that I am not a financial professional by training — I am a software engineer by training. The following is based on my personal understanding, which is gained through self-study and working in finance for a few years.
If you find anything that you feel is incorrect, please feel free to leave a comment, and discuss your thoughts.
Deep thoughts
This blog post, freely available, presents a framework for thinking about the capex spend. It is long and very nuanced, yet concisely written with very little fluff. The kind of article you should read and re-read, to be sure you understand the author’s every word. Certainly DO NOT try to summarize this using an LLM1.
Honestly, you really shouldn’t use LLMs to summarize or analyze anything, lest you end up confidently arguing about “straight line capitalization”, which to be absolutely clear, is NOT a thing — it is entirely hallucinated. ↩︎
This is a quick note, which tends to be just off the cuff thoughts/ideas that look at current market situations, and to try to encourage some discussions.
The Iran war has been going on for about two and a half months now, and despite the ceasefire, I am getting concerned. Again.
As usual, a reminder that I am not a financial professional by training — I am a software engineer by training. The following is based on my personal understanding, which is gained through self-study and working in finance for a few years.
If you find anything that you feel is incorrect, please feel free to leave a comment, and discuss your thoughts.
Not that quick
Technically, this was branded as a quick note, but the Iran war is a lengthy topic, so this is going to be a long post. Start your white noise machine and get comfortable — I expect half of you to be asleep before reaching the end of this post.
Quick background
For those who haven’t been following — The USA and Israel attacked Iran in a surprise attack on February 28th, 2026. This is despite ongoing diplomatic meetings in Geneva where some progress was made.
The attacks resulted in retaliation from Iran on multiple Gulf Cooperation Council (GCC) member countries, with severe damage dealt to US military bases as well as various energy (crude oil, refined products and natural gas) infrastructure in the region.
In addition, Iran also announced the closure of the Strait of Hormuz, a critical maritime chokepoint for shipping energy products out of the GCC countries, and shipping their imports in. Currently, traffic through the Strait of Hormuz has dropped from around 100-150 ships per day, to 0-20 a day — only ships that pay a toll to the Iranian regime and receives approval from them are allowed to transit.
Naturally, this has led to a severe shortage of various energy products in the world. As a response, the USA has also imposed a retaliatory blockade of Iranian shipping vessels.
Economic impact
Prior to the war, the Strait of Hormuz was used to ship around 20million barrels of crude oil per day out of the Gulf countries. Global crude oil consumption on a daily basis is around 100million barrels, so the closure of the Strait of Hormuz immediately curtailed around 20% of global crude oil intake.
At the same time, the Gulf countries have over the years started developing more value added energy related services, such as exporting refined products, as well as various oil refining byproducts such as helium, sulphur and various fertilizers or fertilizer inputs.
While some of these products are still being exported today via bypasses, such as the East-West pipeline in the Kingdom of Saudi Arabia, taking into account all bypasses still results in a shortage of around 10-13 million barrels of oil from the region. To be clear, some analysts have falsely claimed a much higher rate of bypass, but this is easily disproved by just looking at the shut-in of production in the Gulf countries (i.e. how much less crude they are producing a day). You simply cannot export something that you have not extracted yet.
At the same time, there are some who claim that because Very Large Crude Containers (VLCCs) can ship around 2million barrels of oil each, we only need ~10 ships to transit a day, a number which seems to be already happening. This is, in my opinion, simply wrong.
The easiest counter argument is simply this — prior to the war, 100-150 ships transited per day. If we only need 10, what were the other 90-140 doing? They certainly were not all cruise ships!
The fact of the matter is that there are 3 main types of ships involved — crude tankers, gas carriers and bulk carriers. You cannot load crude oil on gas carriers or bulk carriers, you cannot load natural gas on crude tankers or bulk carriers, and you cannot carry bulk goods in crude tankers or gas carriers. As a result, many ships tend to enter or exit the region empty (e.g. crude and gas carriers enter empty and leave loaded).
At the same time, the region exports a lot more than just crude oil. The world is also in need of the region’s fertilizers and fertilizer inputs, helium and various other refined oil products.
Finally, the main reason why the region even bothers to export all these goods, is so that they can earn foreign exchange to pay for imports that they actually want. If the flow of imports is completely curtailed, it seems their need and will to export will also be reduced.
A simple empirical proof that the current limited number of transits is nowhere near enough is the number of ships entering the region (as opposed to exiting). Unfortunately, I can’t find a clean graph that shows the data, but if you are willing to dig through news articles over the past few weeks, you’ll notice that almost all the ships transiting are exiting the region, not entering. Without new ships entering the region, existing ships within the region will eventually dwindle down to nothing and the export flow will pause/diminish.
Ships stuck in the region
As mentioned above, most of the ships transiting the strait currently are east-bound (i.e. exiting the region). The number of ships estimated to be stuck within the region unable to get out is around 1500-2000 ships, so at the rate of ~20 a day, we’ll need a few months before all of them are out.
Some of these ships have been in the region for months, and are running low on food, fresh water and other necessities of life, leading to potential humanitarian disasters. Countries in the region are reluctant to provide too much aid to these ships for fear of angering Iran, and likely also because they themselves have been starved of imports for a while now.
Shut in
More importantly, the fact that the ships in the region have been there for almost 3 months suggests that those that were planning to ship exports out of the region are already loaded.
From my understanding, crude oil and natural gas extraction while very different in nature, share some characteristics. In both cases the output needs to be stored in specialized containers. Given that existing ships in the region are likely fully loaded, newly extracted oil and gas will need to be stored in storage containers on land. These tend to be relatively limited in capacity and many estimates I’ve seen suggest that most of the region’s land capacity are filled up.
As a result, oil and gas wells need to be shut in, i.e. temporarily closed. When an oil or gas well is shut in, there is a chance that damage to the well or equipment is sustained, resulting in reduced pressure and thus reducing the amount of extractable oil/gas. In extreme cases, the well may become completely inoperable.
The longer these wells are shut in, the higher the chances of problems in the future. While likely most of the problems can be overcome with enough effort, this does incur significant investments as well as time — some estimates I’ve seen suggest that from the date of wells reopening, it may take a year or more before the region’s energy exports get back to pre-war capacity.
Now, add in the fact that many ships outside the gulf region have moved to other parts of the world to do business, while land storage is full. Even if the war magically ends today, it’ll likely take a significant amount of time for ships to return to the region, relieve the land storage of their contents, before we can even think of reopening the wells (which is when the “one year or more” timer starts).
Bypass
A quick word about the bypasses. There are 3 main bypasses that are operating:
The East-West pipeline in Saudi Arabia.
The Habshan-Fujairah pipeline in the United Arabs Emirates (UAE).
The Iraq-Turkey pipeline.
All three pipelines are operating but at various levels of utilization.
The East-West pipeline takes oil out of the Persian Gulf (which opens into the Strait of Hormuz) and into the west coast of Saudi Arabia, the Red Sea. The Red Sea has two egresses — to the north, there is the Suez Canal and the Mediterranean and Europe, and to the south there is the Bab el-Mandeb which then leads to Asia.
Unfortunately, the Bab el-Mandeb is bordered by Yemen, where the Houthis are situated. The Houthis are allies of the Iranian regime, and have previously managed to successfully disrupt shipping out of the Red Sea via the Bab el-Mandeb. While the Houthis have not done much so far in this war, they have made verbal promises of coming to Iran’s aid if/when requested. There is speculation that the Houthis are not keen to enter the fight — they last closed the Bab el-Mandeb in 2023 in a conflict that is technically still ongoing, but paused due to a ceasefire that began in 2025. Whether that is true, or whether the Iranians have simply been holding the Houthis back in reserve is unclear.
Thankfully, the Red Sea has another egress via the Suez Canal. However, the canal is man made and has much smaller limits on how many ships can transit in a day. At the same time, the canal is narrower than the Bab el-Mandeb, and the largest ships than can transit are SuezMax ships, which hold roughly 1million barrels of crude at most, half of what a VLCC can hold.
The Iraq-Turkey pipeline has been in and out of development for a while now, and from my understanding, while it is operational, it has very low capacity and there are technical/legal issues to ramping that up quickly.
All 3 pipelines also share a similar downside — they are all within range of Iran’s missiles. While Iran has not made any moves in this area, they have promised that if more attacks were to be initiated on Iran, they’ll hit all energy infrastructures in the region, which likely includes these 3 pipelines.
Agriculture
The Persian Gulf region exports a large amount of fertilizers and fertilizer inputs which are used all around the world, including here in the USA. As a result of the closure, prices of fertilizers have increased dramatically.
Each agricultural growing region in the world are typically split into multiple plantings. These planting periods are different depending on the crop and the region of the world, but as a sort of crude approximate, there are 2 plantings during the summer in the USA. The first is around April to May, and the second is around July to August.
My understanding is that for the April/May planting, most farmers have already ordered their fertilizers before the war started and so are relatively unaffected. However, some crops require additional fertilizers after they are planted, and that may be affected. Also, if the war drags on long enough, the July/August planting may also be affected, since farmers don’t typically store fertilizers for more than a few weeks, though they may have been able to lock in pricing from before the war.
Other than fertilizers, the business of agriculture is also heavily dependent on fuel, as modern farming relies heavily on machinery to do most of the heavy work. The increase in fuel prices due to the closure adds significant costs to farmers’ operating expenses.
At the same time and unrelated to the war, this year is forecasted to be a strong El Nino year. While El Nino affects different parts of the world differently, my understanding is that El Nino will be a net negative for global agricultural production.
Put all these together, and we get pretty substantial impacts on food supplies. For example, wheat prices went limit up (went up by the maximum of ~7% in a single day) on May 12th, as farmers reduce the amount of wheat they plan to grow this season. At the same time, prices of various other agricultural products such as sugar and corn are also pushing towards recent highs, for similar reasons.
Inflation
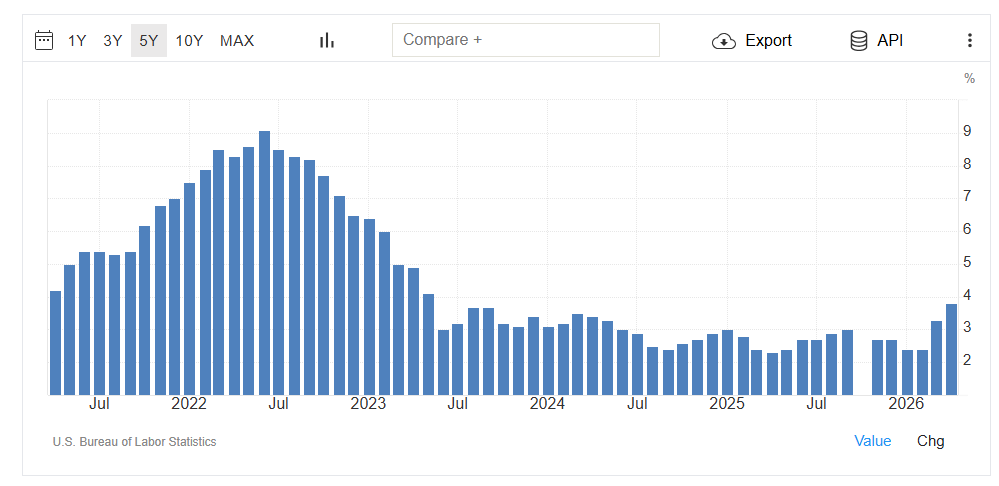
Covid in 2020, the Russia/Ukraine war in 2022 and the government’s response to both events led to high inflation in the USA starting in 2021. That reached a peak of around 9% in 2022 before slowly coming down.
With the Iran war and the closure of the Strait of Hormuz, fuel prices have gone up significantly throughout the country, and as discussed above, food prices are starting to go up as well.
It is important to note that while fuel prices are the most directly linked to increased crude oil prices, crude oil is involved in pretty much everything we interact with daily, from the diesel used to transport goods, to jet fuel used for planes, to fertilizers for our crops, to asphalt lining our roads, to material used for clothing, furniture, etc.
Because some of these products are very far downstream from crude, involving multiple steps of refining and manufacturing, increased crude prices may take weeks or even months/years before the prices of the final products are affected.
Currently, Iran appears to believe they are winning the war, as the demands they’ve made just to begin peace negotiations include what the US would likely consider red lines:
Lifting of the US blockade.
Iran retains control of the Strait of Hormuz.
Lifting of all US sanctions on Iran.
War reparations for damages dealt by the US and Israel.
Release of frozen Iranian assets.
No discussion of Iranian nuclear issues until after the conflict has ended.
Given that these demands essentially removes all US/Israel leverage in any future negotiations, and effectively amounts to a US/Israel unconditional surrender, it’s hard to imagine that the US/Israel will look kindly on the demands.
On the other hand the US demands for the same peace negotiations to begin:
Long term nuclear moratorium on all Iranian uranium enrichment, with the dilution or removal of existing nuclear material within Iran.
Iran end all support for regional proxy groups like Hezbollah, Houthis and Hamas.
Reopen the Strait of Hormuz by the Iranians, though the US may maintain its blockade.
While the US offers the possibility of sanction relief and return of some/all frozen Iranian assets, it is pretty clear that their list of demands will be entirely unacceptable by the Iranians as well.
At the core, the facts are:
Within a year, the US/Israel launched two surprise attacks on Iran during diplomatic negotiations, once in June 2025 (the Twelve-Day war) and another time in Feb 2026 (the current Iran war).
Both times, the US and Iran were in the middle of negotiations centered around US sanctions on Iran as well as Iran’s nuclear enrichment programs.
As such, it seems natural for Iran to be suspicious of another peace overture from the US/Israel, and likely they’ll want some guarantees that it’s not another trick/trap.
Since there are no practical ways for any entity on Earth to ensure/guarantee that the US/Israel will not launch a third surprise attack, Iran likely wants to retain some amount of coercive force to defend itself. The two main prongs of that defense posture would be control of the Strait of Hormuz, and thus control over roughly 20% of crude oil used globally, as well as a credible nuclear deterrent. Both of which the US demands to be removed from the table.
Time’s running out
While only about 10% of daily crude oil consumption worldwide is affected, the fact of the matter is that the world simply cannot operate without crude oil and even relatively small changes can have significant impact. It is important to note that historically, OPEC has generally adjusted crude oil production up or down by a few hundred thousand barrels a day at a time, and even those adjustments tend to have significant impact on prices. We are currently seeing a reduction of supply 10 times higher.
JP Morgan recently published an update estimating that at the current rate, the world will face significant operational stress by June, and by September we’ll hit operational minimums. It is important to remember that while the world has large buffers of crude oil stored away for an emergency such as this, the reality is that much of those oil is simply not accessible — tanks need a minimum amount of oil to operate and pipelines cannot operate if they are empty. While we can technically drain tanks and pipelines completely, the process is slow and tends to result in irreversible damage. Hence the notion of operational minimums — if storage levels fall below that, we simply cannot efficiently (or at all in some cases) retrieve the stored oil.
As of today, June is just 2 weeks away, and September is only 3 more months after that. We simply do not have a lot of time left.
Hopefully the USA, Israel and Iran can reach a peace agreement soon, but given that the current ceasefire started in early April and both sides are still so far apart, I am genuinely worried.
Export ban
Before we end, a quick word on a potential export ban. Some have suggested that because the USA is “energy independent”, if push comes to shove, we can simply impose an export ban on crude and/or its refined products, so the impact on Americans will be significantly reduced.
While that idea isn’t completely wrong, recall from above that crude is used as input for a wide variety of things, many of which are not produced in the USA. An export ban will necessarily increase the price of crude and its products outside of the USA, which then will increase the cost of our imports. Remember also that those imports necessarily must be shipped in or flown in, and ships and planes run on fuel. Fuel that is typically topped up at the point of origin, i.e. outside of the USA, and thus more expensive.
At the same time, an export ban will shift a lot of the pain from Americans to the rest of the world. This will likely lead to significant financial/economic stress outside of the USA. Given that the USA is tied closely to the rest of the world via trade links and services, if the rest of the world is in severe distress, we’ll likely be impacted too, via increases in the price of imports, via a decrease in the demand of our exports and our digital services, etc.
So, strictly from an energy perspective, the take isn’t completely wrong, but it is not a panacea, and Americans will be impacted, even if the ban is instituted.
What is the difference between the circuit breaker and limit up/down rules? How do these affect pricing between ETFs and their underlying assets, especially with respect to arbitrage?
As usual, a reminder that I am not a financial professional by training — I am a software engineer by training. The following is based on my personal understanding, which is gained through self-study and working in finance for a few years.
If you find anything that you feel is incorrect, please feel free to leave a comment, and discuss your thoughts.
WEAT
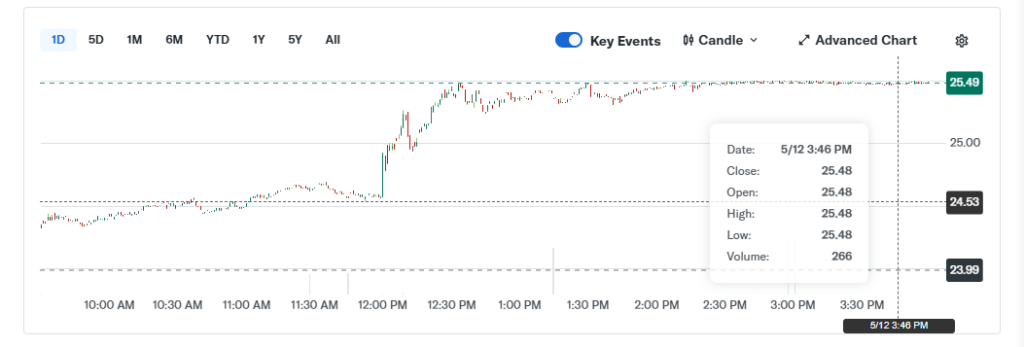
This is how WEAT traded yesterday, on 12th May, 2026:
WEAT trading on 12th May, 2026. Courtesy of Yahoo Finance.
Notice how the trading towards the end of the day was pinned at around $25.48 per share, and pretty much never deviated? How do we explain this? Is this market manipulation?
ETFs
WEAT is an ETF which holds wheat futures. Because it is almost literally just a container for a bunch of wheat futures, and both WEAT and wheat futures are actively traded and relatively liquid instruments, market makers can step in to arbitrage between the two — basically if WEAT is underpriced relative to the futures, the market maker will buy (relatively cheap) WEAT, exchange it for the futures with the sponsor of the fund, and then sell the (relatively overpriced) futures. Doing this will yield the market maker a small profit in the round trip, and so effectively force the price gap to become smaller. If WEAT is overpriced relative to the futures, the market maker will simply do the reverse (buy futures, sell WEAT).
Given that market makers are making money each round trip (i.e. they start with cash and end with cash), they can do this effectively forever until the price closes “completely” (there’ll always be a small difference due to trading costs and other various frictions).
So what happened here? Why did the market makers not do their jobs?
Circuit breaker
The circuit breaker is a mechanism in the stock markets where trading is completely stopped (halted) for some period of time. This happens when the trading is determined to be unorderly according to some rules set forth by either SEC, FINRA or the exchanges. A circuit breaker can be per instrument, set of instruments, or for the entire market.
The rationale behind circuit breakers is that there are times where there is excessive panic (or exuberance) in the markets on a short time frame, and so markets are not trading orderly. To restore order, trading should be halted until participants have sometime to calm down and think clearly before acting again.
Limit up limit down
Limit up limit down, often called LULD, is a type of circuit breaker for stock markets, where each stock can only trade within a predefined band of prices. To simplify massively, stocks can only trade within a band referenced off the average price of the stock in the past 5 minutes. When trading approaches the upper or lower bounds of the trading band, the circuit breaker is triggered and trading in that stock is halted temporarily.
Futures
Notice that I explicitly stated that LULD is for stock markets. While WEAT is a stock, and thus affected by LULD, the underlying wheat futures are not (they are futures!), and so not affected by LULD.
Instead, futures are affected by special limit up/down rules depending on the type of future. In particular, wheat futures are affected by CME’s agricultural price limit rules. In particular, these rules do not include a halt. Instead, wheat futures are simply disallowed from trading outside of the band — bid and ask prices outside the band are simply ignored.
This is why it is important to understand the difference between “circuit breaker” (i.e. what happens) from “limit up/down” (i.e. how it happens). For stocks, limit up/down rules trip a circuit breaker. For futures, they do not.
Circuit breaker != limit up (or down).
What happened
By now, you probably would have guessed what happened. During regular trading hours yesterday, wheat futures hit the top of their price band, and simply isn’t allowed to trade beyond that price.
WEAT, the ETF, on the other hand, traded fine within its own limit bands, and so circuit breaker on WEAT was not tripped.
Therefore, both WEAT and wheat futures continued trading, with the caveat that WEAT (and wheat futures) are capped at a price beyond which they won’t trade (technically, WEAT can trade slightly above the price due to temporary market making glitches, but that’s rare).
This is why the trading in WEAT towards the close was basically a straight line at the $25.48 mark. I guess you can call this market manipulation, in the sense that an authority, in this case CME, is imposing an artificial price limit. But in some sense, this is the good (and legal) kind of market manipulation.
Bid more for the ETF?
Now, based on the discussion above, you’ll note that while bids/asks above the price band of wheat futures are simply ignored, the same is not true for WEAT. Given that WEAT is trading pretty much at the same price for hours, it is unlikely that it is anywhere its limit up/down limits (based off the average price of the past 5 minutes).
So what happens if we bid, say, $30 for WEAT? Wouldn’t sellers be happier and thus accept our higher bid?
Well, the answer is more complicated and nuanced, so let’s lay a little groundwork.
Trading
Let’s say you are trading wheat futures. And for whatever reason, you need to sell 10,000 contracts today. Maybe you’re a farmer and you need to hedge your production to the tune of 10.000 contracts. Maybe you are a hedge fund trader and your portfolio manager asks you to buy sell that many contracts. Whatever.
First, it is important to recognize that 10,000 contracts is quite a large fraction of the daily volume of wheat futures contracts traded, so you probably don’t want to trade everything all at once in a single order — you’ll move the market against you and thus get a worse price. Instead, you will break up your order, and trade it slowly over the day. Maybe 100 contracts every few minutes, or whatever proprietary algorithm you may have.
If the market is operating normally (i.e. not limited), you would place an order for 100 contracts. If it trades quickly, then you probably priced it too low, so your next order will have a higher limit price. If it takes too long to trade, you may conclude that you priced it too high, so you will adjust the limit price lower. This is an iterative process, where you are basically trying to guess the best price you can get for each batch of contracts, until everything is sold.
If you think about it, there is no guarantee where the trade price of each order is — each order may trade higher or lower than the previous order, because you don’t know where the buyers are willing to transact — you’re just trying to get the best price for each order, and doing it via trial and error.
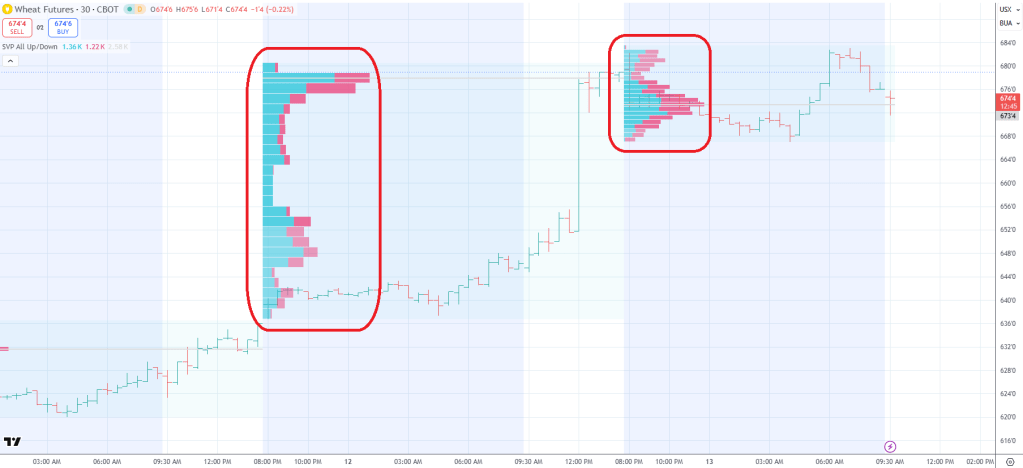
Now imagine an entire market of uncorrelated participants all trying to do the same thing either on the buy side or sell side. What tends to happen, is that the trading volume will resemble some sort of bell curve (more accurately, multiple bell curves overlaid on each other) if you plot the histogram of volume at each traded price (also called the volume profile):
Wheat futures volume profiles (boxed in red) for 12th and 13th May, 2026. Courtesy of TradingView.
I’m terrible at statistics, but I’m guessing there is a statistical reason for the bell curves phenomenon.
The point here is that trading can be thought of as a series of auctions, and when unencumbered, trades tend to cluster around some focal points (the peaks of the bell curves) over time. This doesn’t mean that the instrument will trade at any particular price, or close at any particular price, just that there is a high probability of it doing so.
Back to our example. You are still trying to sell 10,000 contracts of wheat futures. But this time, there is a limit up price imposed — you simply cannot trade beyond the upper limit price. What would you do?
Remember that you are not a market maker — you are not authorized to exchange WEAT with their underlying futures with the sponsor of WEAT — shorting WEAT is out (or at least, too complicated for your operations). So you’ll stick with selling future contracts.
If we are trading well within the price bands, you’ll probably follow the trial and error approach outlined above. But once the trading starts bumping up against the upper price limit, it makes sense to simply just put out your orders at the price limit. There is literally no higher price you can get!
Now, you may not put in an order with ALL the contracts you still need to sell, because that’ll tip your hand and let the buyers know that there is a motivated and large seller on the other side. So you’ll still send out small orders of maybe 100 contracts each. But they’ll all be priced at the price limit or just below.
End result
What happens then, is that you see on both WEAT and wheat futures a smallish set of resting orders (i.e. orders from buyers/sellers with limit prices that haven’t traded yet). The volume will generally be much smaller than the actual number of contracts that buyers and sellers want to buy/sell in total (this is true for basically all markets).
If someone tries to bid $30 for WEAT, what’ll happen is that that order will take out all the resting sell orders at $25.48, and then immediately be met with a wall of (short) selling from market makers at $25.49 (or slightly higher). The market makers will then buy wheat futures at the limit price, exchange them for WEAT shares and use those to close their initial short.
While it is technically true that WEAT can trade significantly above $25.48, in order to do that, it must:
Take out all resting orders for WEAT at $25.48
Take out all resting orders for wheat futures at the limit price
Take out all other resting orders of WEAT higher than $25.48
The last point is the important part — if we assume that $25.48 corresponds to the wheat futures limit price with a small delta for “regular market making profit”, then anything above, even 1c above like $25.49, would represent “large, free and riskless” profit for the market makers. Likely, there’ll be a ton of resting orders sitting above $25.48, based on what market makers assume the actual volume of wheat futures sellers there are.
So, if your order to buy at $30 is large enough, you may very well take out the entire set of resting sell orders for WEAT and so trade at significantly higher than $25.48. But almost immediately after your order is traded, the sellers of wheat futures who have been sitting on their orders in order not to tip their hands will again send out their sell orders. And since they cannot sell beyond the price limit, they’ll effectively result in the market makers putting up a stack of sell orders at $25.48 (and just above) again.
In the end, your giant $30 buy order will just result in a bad price for you, and “free, riskless and large” profits for the market makers.
The only real way WEAT can trade significantly above $25.48 for extended periods of time, is if there is so much buying at higher prices that we exhaust ALL sellers of WEAT and wheat futures at the price limit.
How much buying will be needed? It’s hard to say for sure, since most institutional sellers will try to hide their total intended size. But I’m guessing it’ll be in the tens to hundreds of millions of dollars. At least.
This is a quick note, which tends to be just off the cuff thoughts/ideas that look at current market situations, and to try to encourage some discussions.
I’ve been following the Iran war closely since it started, and when the ceasefire was announced, I was cautiously optimistic. However, since then nothing seems to be happening and, frankly, the world is running out of time. The urgency of the issue is starting to be discussed in the traditional media. Here, the Wall Street Journal goes over the high level problems with regards to the closure of the Strait of Hormuz.
As usual, a reminder that I am not a financial professional by training — I am a software engineer by training. The following is based on my personal understanding, which is gained through self-study and working in finance for a few years.
If you find anything that you feel is incorrect, please feel free to leave a comment, and discuss your thoughts.
Some think of it as voodoo magic, others think of it as crayon drawings on price charts. But does technical analysis actually work? If so, why don’t more people do it?
As usual, a reminder that I am not a financial professional by training — I am a software engineer by training. The following is based on my personal understanding, which is gained through self-study and working in finance for a few years.
If you find anything that you feel is incorrect, please feel free to leave a comment, and discuss your thoughts.
Definitions
Before we dive deeper into the subject, let’s first define what technical analysis and fundamental analysis actually are.
The definitions are not particularly rigid and different people may have slightly different definitions, but to me, fundamental analysis is the attempt to value an asset, based on its fundamental metrics. For example, trying to value a delivery contract (e.g. futures contract) via the value of the to be delivered item, as well as the current risk free rate, or trying to value a share of a company based on the company’s revenues, expenses, growth rate, etc.
On the other hand, I take a somewhat more expansive view on technical analysis. To me, technical analysis is the attempt to determine whether the price of an asset is going to go up or down, and/or by how much, based solely on non-fundamental metrics. For example, looking at the price charts and trying to discern where prices are moving next, looking at trading volumes to determine investor sentiments and how that translates into price movements, etc.
Does it work?
There are many different types of technical analysis, due to the expansive definition above, and to be honest, most of them, I’ve found, do not work (at least, not any more). And even the ones that work often do so erratically. That is, technical analysis is not consistent.
To explain why, let’s consider a simple mean reversion model: We take the last 20 days of closing prices of a stock and compute the average closing price over those days. We then calculate the standard deviation of closing prices over those same 20 days. If the price moves above 2 standard deviations of the current average price, we short the stock hoping it’ll go down back towards the average price, and if the price moves below 2 standard deviations of the current average price, we buy the stock, hoping it’ll go up back towards the average price.
Astute readers will note that this is a simple Bollinger Bands trading system — the upper band is simply the average price + 2x standard deviation, and the lower band is simply the average price – 2x standard deviation, and we simply buy/sell if the current price moves outside of the bands.
Now, this model has a basis in statistics — In statistics, observations outside of 2 standard deviations of the mean in either direction are sometimes called outliers, i.e. these data points appear to be anomalous to the data series. And given that these data points are unexpected, then it somewhat makes sense that they will mean revert, thus restoring the “balance”.
To frame the model from a human perspective, let’s say we have a stock that normally trades somewhat calmly, moving a few points a day. However, on a particular day, it suddenly drops by 100 points, for no obvious reasons. Well, given that nothing untoward appears to have happened, traders are likely to think of it as either a fat finger mistake, or someone needing liquidity in a hurry, instead of something fundamentally wrong with the company. If so, then it makes sense that this is a good buying opportunity, and the buying generated by these traders would cause the price to go up towards the average price again.
Before we dig deeper into this case study, let me get these out of the way:
This is an actual trading system, you can read a somewhat more modern take on this here.
I can verify that this trading system somewhat works (more on this below) in the past, for certain assets.
This trading system does not work for every asset today. It may not even work for any asset today (more on this below).
Regardless of if you approach this from a statistics point of view, or from the human behavioral point of view, you cannot escape a glaring conclusion — this trading system does not always work. That is, if you adhere strictly to the rules to buy and sell based on this trading system, you will suffer (at least) occasional losing trades.
From the statistics point of view, it should be clear that being, well, a statistical measure, this trading system must therefore be subject to tail events that fall outside of the model’s predictive powers. Which is to say, statistics does not guarantee that things will happen a certain way, it simply suggests that they are likely to.
From a human behavioral point of view, recall that we said “it suddenly drops by 100 points, for no obvious reasons“. The bolded part is key — just because we (or even the majority of traders in general) do not perceive some reason for the drop, doesn’t mean that there isn’t an actual reason! It could be that some bad news affecting the fundamentals of the company was leaked, and we simply are not privy to that information. If so, then the drop may be justified, in which case, the expected rebound of the stock price may not occur.
Another reason this trading system may no longer work is based on simple logic — this trading system was designed decades ago in the 1980s. That is a really long time ago in a competitive space like trading. If you knew that everyone knows of this system, and expects a large number of people to employ this system, what do you think should happen?
Well, firstly, as the system becomes more well known, more and more traders will start using it. As a result, it creates some sort of self-fulfilling prophecy — even if the drop was indeed due to some bad news, if enough traders are simply buying because the price dropped 2 standard deviations, then the price of the stock will go up, at least until the bad news is more widely known.
Now, let’s say you are avant-garde trader living on the edge. How would you exploit this phenomenon? For one thing, you can simply try to sell your position a bit earlier — if there is indeed bad news, you want to sell before the bad news becomes widely known, and if there isn’t bad news, you want to sell before others start selling which would drag down the price somewhat.
So one person starts selling earlier, and they make a consistent profit. Other traders notice, and so they too start selling earlier. To counteract this, our enterprising trader decides then to sell even earlier, to which the response from the other traders is to sell even earlier. This continues until everyone is selling so quickly that the price doesn’t really have much time to move, and nobody really makes a profit from this trading system.
Which is to say, for most technical based trading (in case this is not clear, this includes quantitative trading models), eventually the efficacy of the model fades as more and more people know about it and try to work around it, thus competing away the potential alpha of the model.
So.. it doesn’t work?
While it is true that most trading systems based on technical analysis eventually get watered down due to competition, it doesn’t mean that they don’t work.
Going back to our Bollinger Bands example, we noted that eventually “nobody really makes a profit from this trading system”. So if you aren’t making a profit from this trading system, why bother? And so, traders will eventually stop using it.
But the only reason the trading system doesn’t work anymore is because too many people are using it, and if people stop using it, it should work again… right?
This is a contradiction that has multiple possible (un)stable equilibriums. In some cases, certain technical analysis models have a low capacity, which is to say, as more money gets put into trading the model, the model stops working relatively quickly — it has a low capacity for the marginal speculative dollar before it stops working. Models like this tend to be cyclical — the model works for a while, it becomes overheated and traders start losing money, so everyone stops using it, and so it works again. This on again and off again nature of the model repeats over time as new traders start using the model and abandoning it.
A possible stable equilibrium is that the model because incorporated into some other, larger and more comprehensive model, and so it more or less stops working permanently.
Yet another possible stable equilibrium is that the model gets just enough usage from traders that it works well enough just for those traders, who manage to somehow dissuade others from employing it (for example by keeping it a secret). The model works decently, well enough for its traders to be sufficiently profitable, but not well enough for other traders to spend the effort to try and decipher it.
Practical technical analysis
It should be clear by now, that a large part of the job of quantitative trading is to try and figure out which models work, which don’t, and when. Successful quantitative traders need to be able to not just encapsulate the trading system, but also a risk management system that monitors when your trading system stops working and makes adjustments as necessary. Alternatively (or in addition to), you could have a macro overlay, which tries to predict when the trading system will stop working, before it stops working.
For example, if we are trading the Bollinger Bands setup as described above, a simple risk management system would be if the price moves from beyond 2 standard deviations of the average price to beyond 3 standard deviations, we simply close the position at a loss. This is based on the guess that if the price is moving strongly in a direction, there’s a good chance that there’s something we don’t know yet which may justify the move.
And a macro overlay could be as simple as “do not trade a stock using this system within the 3 trading days after its earnings report” — this is based on the very obvious observation that earnings report days are more likely to feature fundamental changing news, so we want to ignore any large moves shortly after an earnings report because the moves may be justified by fundamentals.
Technical analysis for the enthusiast
For those of us who aren’t doing this for a living, and cannot afford to spend the massive amounts of resources to build out a full quantitative trading system, technical analysis can still be of use.
Recall that technical analysis is just a way of trying to quantify the sentiments around the price movements of an asset. To put it crudely, you’re just trying to use some sort of formal or semi-formal method to try and guess what other traders are thinking and how they may react.
To that end, I’ve seen some success using various technical analysis measures to try and give me a “feel” of the market, so as to try for better entry/exit points. Which is to say, I may use fundamental analysis to guess whether the asset’s price will go up or down in the medium to long term (say more than 1 month). But once I’ve already decided to buy or sell an asset, I can then use technical analysis to try and guess whether the asset’s price will go up or down in the short term (say under 1 week), to decide when to actually effectuate that trade.
The world is ablaze with talk and speculation on Artificial Intelligence (AI), with untold billions of dollars poured into AI related companies.
As usual, a reminder that I am not a financial professional by training — I am a software engineer by training, and by trade. The following is based on my personal understanding, which is gained through self-study and working in finance for a few years.
If you find anything that you feel is incorrect, please feel free to leave a comment, and discuss your thoughts.
Words
Before we delve into the topic, a very brief history of AI and its related fields in the form of a mini glossary:
Artificial Intelligence (AI)
The term AI was originally used to mean intelligence that rivals that of the average human, and which was created by humans (i.e. not natural). The formal study of reasoning and how it can be applied via computer science began in the 1940’s, and over the decades, many have herald the imminent emergence of AI. Over the decades, many have been wrong about the imminent emergence of AI.
Machine Learning (ML)
ML is a term specific to computer science, and describes a field of study that encompasses many different technologies. ML is differentiated from AI in that while it aspires to human-level intelligence, it is mostly concerned with how to make machines (specifically computers) “smarter”, to learn and to improve.
Artificial Neural Network (ANN)
ANNs are an application of ML, i.e. a technology created as part of the study of ML. First invented in the 1970’s, ANN seeks to mimic the human brain by defining computing nodes akin to human neurons. These “neurons” are then connected to each other via a hierarchical layer structure. Each “neuron” operate independently of the others in the same layer, and all “neurons” in the same layer get input either directly or transitively from “neurons” of prior layers, with the final “neuron(s)” being the output of the entire network.
ANNs, and a close cousin Hidden Markov Models (HMMs), have been used very successfully over the decades in various applications, providing impressive results.
Large Language Models (LLMs) encapsulate many of the features of the above, and a lot more not discussed, and have been extremely successful in producing almost human-levels of prose. Recent (circa 2023) developments in LLMs have resulted in the ability to generate not just text, but also other contents such as graphics and video. These latest developments are coined Large Multimodal Models (LMMs), and today, the terms LLM and LMM both generally refer to the latter.
The simplest (and somewhat crude) way of describing a LLM is that it is a statistical prediction model — given a stream of input such as words, what would be the most likely output (such as words of a prose, or pixels in a picture).
Grade inflation
Today, the term AI is used interchangeably with ML, or more specifically LLMs. This is despite the fact that most practitioners agree LLMs are not quite on par with human-level intelligence. To differentiate human-level intelligence and what LLMs are capable of today, a new term Artificial General Intelligence (AGI) was coined to refer to what AI used to mean.
I’m more of a traditionalist when it comes to definitions, and am not a fan of this marketing gibberish and rampant grade inflation, so for the rest of this post, I will be using AI to mean the original definition above.
State of the art
As mentioned above, as of this article, LLMs are extremely capable of producing prose and visual content that is at almost human level. In particular, many have found great success with using LLMs to produce code (also called Vibe Coding), where the user uses spoken English as input to the LLM in order to get it to produce (hopefully) useful source code, such as in C++ or Python.
However, as LLMs are not really thinking models, but rather statistical prediction models, they are prone to errors, sometimes called hallucinations. Nobody really understands what causes hallucinations or what they mean, but my personal take is that it is an artefact of the LLM being fed inputs that it simply hasn’t encountered in training before, and in such a way that its interpolation or extrapolation of the input results in output that is simply garbage.
There are techniques to working around hallucinations, such as feeding the output back into the LLM and asking it to rework or rethink through its response, effectively a mulligan. However, this is generally only applicable when the user can recognize that the output is wrong — if the user simply does not have the ability to evaluate the correctness of the output, then chances are the user will just end up believing the garbage.
Practical concerns
Despite the hype of the imminent emergence of AI, I am less optimistic. But even without AI, ML (and LLMs) can be of practical use. There are many areas where it is fairly easy for the user to verify the correctness of LLM output, such as when vibe coding (if the code compiles, and if the code does what the user wants), prose generation (user can read the prose) and graphics/video generation (look and see!), and in these respects, LLMs have proven to be huge time savers and productivity boosters.
Central to these use cases is the cost benefits analysis — if it is more cost effective to have a human produce the content, then it doesn’t make sense to have LLMs do it. Today, the cost to end-users of using LLMs is pretty cheap, with pricing around single to low double digit dollars per million tokens, where you can think of a token as somewhat like a “sub word” (some words cost one token, others may cost more). With the Lord of the Rings trilogy being less than 500k words, a million tokens is plenty!
And this is where hallucinations come in. The problem with the above paragraph is that while in the ideal scenario, you can almost produce the Lord of the Rings trilogy with a million tokens (~$10!), the reality is that you’ll likely end up with garbage — hallucinations tend to creep in pretty quickly, and without constant human supervision to read the output and force the LLM to redo/rework parts of the output, it simply won’t be very good.
In the end, in order to produce 500k words of actually useful and entertaining prose, the user may end up spending many millions of tokens, with most of them wasted due to hallucinations. More importantly, a lot of human time will be consumed reviewing and effectively redoing the LLM’s work.
Whether this is worth it depends a lot on the project at hand and the user’s circumstances. As an example, for someone who is not trained in computer science, being able to just produce any code would be a huge win. But for a trained and seasoned software engineer, the benefits can be much more dubious, especially when you are considering mission critical code where subtle bugs and security implications are not obvious and the inexperienced will simply not be able to even realize these issues need more thought/work.
My take
My personal take is that as things stand, LLMs are not going to lead to AI, absent dramatic changes to the fundamental basis of LLMs, such that whatever comes out will not look very much like the LLMs of today.
At their core, LLMs and all other related statistical prediction models are generally very good at predicting the “next thing given a series of things”, but are pretty terrible at innovation and making decisions based on novel situations — both critical components of intelligence as most would understand the word. Recall from the examples above, that a human supervisor is still needed to ensure correct output!
In my opinion, LLMs may very well form parts of AI, if and when it emerges, but won’t be the whole. Instead, I have been toying with the idea of a “meta model” — essentially a “thinking” and “decision making” layer on top of a bunch of other “doing” models.
For example, the “meta model” may decide that “for the problem at hand, we need to generate an essay about AI”, and hand the task off to a “doing” model that is based on an LLM. Or it may decide that in order to generate that essay, the LLM needs to be supervised by a more generalized RNN model that researches the output of the LLM to validate correctness in an iterative process — in this case, the RNN model, possibly with aid from the “meta model” will do the work of what the human supervision would be doing today.
This paradigm has benefits — the “doing” models can be specialized to various tasks for which they are best suited. Many tasks required of humans can be easily graded as “right” or “wrong”, and it is in these well defined problem spaces that LLMs thrive. Building bespoke models tailored to specific tasks has, historically, been an extremely successful approach in ML.
What, then, would be used to build this “meta model”? Honestly, I have no idea. If I were to guess, it’d be some hybrid of HMMs and ANNs. HMMs are good at predicting things based on internal, unobservable states and ANNs are good at predicting things based on historical correlations. But that’s just me.
Finance
What does any of the above have to do with finance? This is, after all, a finance blog! Well, a lot.
There are many avenues to invest in LLMs, from NVidia stock (still the gold standard of GPU chips, a critical component of building and running LLMs), to private investments in various LLM startups, to datacenter providers (GPUs need to be put somewhere), to hyperscalers that provide a more hands-off approach to dealing with the hardware.
The key to remember is that as of today, no LLM startup is profitable — all of them are burning money like there’s no tomorrow. Even more concerning, many businesses renting out the hardware for building and running LLMs are arguably in the red, with dubious progress toward profitability. Pretty much the only companies reaping outsized profits in this space are NVidia, and a handful of smaller energy and component suppliers. Actually running the hardware or LLMs has been extremely disappointing from a PnL perspective, despite the huge amounts of investments made.
No hope?
That’s not to say that there’s no hope. With enough research, it might be possible to pivot an LLM startup to actual profitable use, for example by focusing in a vertical where LLMs are particularly suited.
Also, somewhat more cynically, speculating in LLM companies can be profitable for investors if the companies get acquihired by larger players not so much for their products, but for their human talents, in a giant game of greater fools.
It is somewhat ironic that in the business of AI, the most valuable products thus far appear to be the humans.
Weekend video binge
To end, a trio of videos from notable people in the field discussing AI and LLMs. Enjoy!
The SPX just had its worst week since 2020. You know, the year where everything shut down. Because of tariffs that everyone was warned about, for almost a year now. What happened?
As usual, a reminder that I am not a financial professional by training — I am a software engineer by training, and by trade. The following is based on my personal understanding, which is gained through self-study and working in finance for a few years.
If you find anything that you feel is incorrect, please feel free to leave a comment, and discuss your thoughts.
Boom! Tariff the World
After the market closed slightly up on Wednesday (4/2/2025), the president announced the actual tariffs that he and his team have been talking about for months (since before they were elected).
Despite having been forewarned about the tariffs for almost a year, the next day (4/3) markets dropped the most in percentage terms since the early days of 2020 around the start of the pandemic, and dropped even more the day after (4/4). Combined, this is the largest weekly percentage drop of the SPX since the chaos of early 2020, and the largest absolute 2 days points drop ever.
Tariffs He Wrote
Despite the tariffs being announced well ahead of time, it was still shocking because the administration had been touting a “reciprocal tariff”, but when the details were revealed, what actually happened was anything but.
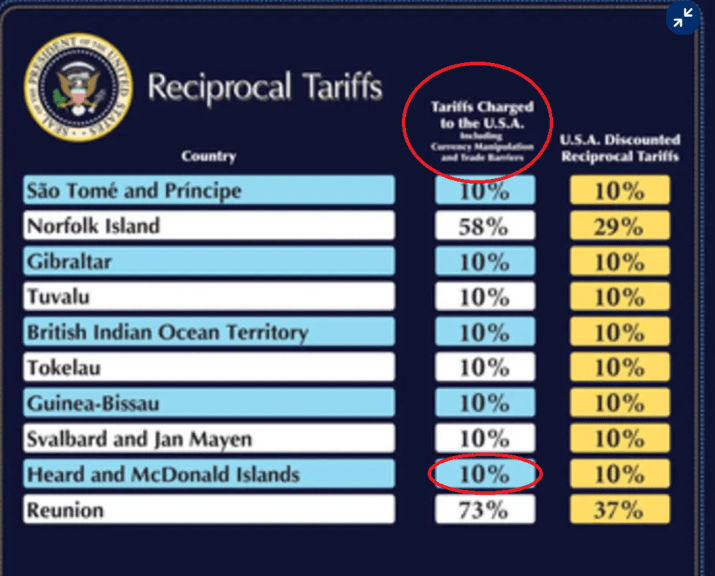
Reciprocal tariffs on most nations would amount to at most 10-20% for most items with a large number of items excluded. Instead, the administration went as far as to tariff effectively every nation by at least 10% for all imports, with some going as high as 50%. To justify the tariffs, the administration came up with what looks effectively like bogus tariffs the nations supposedly charge US exporters, even claiming that an uninhabited island populated mainly by penguins is charging tariffs on US exporters. I guess they don’t really like US fish?
After many commentors cried foul, the administration finally came clean and noted that the supposed tariffs imposed by other nations on US exporters is really just the ratio of US trade deficits to US imports from the country, with a 10% minimum cap.
To be absolutely clear, as many journalists, economists, financial advisors, finance professors and commentors have noted, this equation is utter bovine feces — despite dressing up the explanation with fancy maths symbols (that mean nothing!), the equation is meaningless in both economics and finance, an entire fabrication out of thin air.
Trade Deficits
In this one, incredibly unsophisticated, move, the administration has shown that it is deeply concerned about US trade deficits. So let’s talk about that for a while.
To simplify somewhat, a trade deficit is when a country (USA in this case) exports less to another nation than it imports from that nation. The deficit is simply the dollar amount of the difference between exports and imports to/from that nation.
As a general rule, deficits between 2 nations is a non-issue. Since trade is global and bilateral between different nation pairs, it is inevitable that there is an imbalance in trade between any 2 nations pair.
For example, Madagascar exports mainly vanilla beans to the USA, something that does not grow very well on American soil and climate, and so the USA has no real vanilla bean industry. However, because Madagascar is so poor, with the average person making just over $500 USD a year, there simply isn’t a lot that the average Madagascan can afford, and thus they simply don’t import a whole lot from developed nations which generally produce higher value added, and higher priced, goods — when you make $500 a year, an iPhone really isn’t something you think much about.
In theory, this trade deficit “goes away” when we consider the entire world. Let’s say the US imports a lot of Chinese stools, but exports a relatively smaller amount of tables to China — the US has a trade deficit with China. In the idealized Econs 101 case, this is fine because, in theory, the US will have a trade surplus (exports more to this country than the US imports from this country) with a 3rd country, say, Germany. Germany in turn has a trade surplus with China. So while every nation in our 3 nations scenario has a trade deficit with one nation, they also have a trade surplus with another, and the balance of trade (the sum of all trade deficits and surpluses for a single nation) will be 0, or at least very close to 0 over time, for all 3 nations.
In practice, this doesn’t really work. Empirically, we know that most developed nations have been consistently running balance of trade deficits for years, if not decades. There are many reasons for this phenomenon, but a large part of which is what the president said he is trying to address — unfair competition from some countries, such as China, where a combination of state level subsidies to domestic producers and tariffs or other barriers to foreign producers result in extremely one sided trade dynamics.
Face Off
But are trade deficits really bad? Think about it — some country is putting their citizens to work, and putting in their natural resources, to make a product that they then send to us. That country has spent non-trivial amounts of resources to produce that product, and in return, all they want from us is a few pieces of green paper. Green paper that we, as a country, can create almost for free.
Now, if you look at it from that perspective, it would seem that America should strive for larger trade deficits, not smaller!
Of course, reality is not quite so simple. There are very good reasons why a country would want to have a smaller balance of trade deficit:
It is painful for those workers who are displaced by foreign goods. Yes, perhaps if you reduce the balance of trade deficit, you’ll incur a larger loss of jobs via not creating jobs in new industries that are never borne as the necessary inputs are never imported (as part of reducing your deficit). But as Milton Friedman notes (in the video above), those displaced are real people, with real voices, while those jobs that you never gain? They don’t exist yet, and thus have no say in the matter.
If a country allows its industries to atrophy due to cheaper foreign imports, then at some point, expertise for producing those goods will be lost to that country. This means that any future goods based on that product may not be invented in that country simply because it doesn’t have that industry anymore. For example, a country is unlikely to invent the next generation of chips if they don’t even a chips industry.
There are some products that a country needs in order to be independently strong. For example, steel is needed to build weaponry, and if a country imports all of its steel, then it is at the mercy of whoever sells it that steel — if they cut off supply, and then invades, the country will be in a pretty serious pickle.
A large and prolonged balance of trade deficit is not sustainable. It may not be an issue in the near term, and problems may not emerge for many decades, but eventually, a country’s trade partners may find that they don’t really care for anything it produces, thus they have no need of its green pieces of paper, so they just cut it off from their goods. What then? Without industries, and without the expertise to restart those industries, the country would be at a dead end.
In summary, while deficits in the short term are good — they improve the average standard of living of the country’s inhabitants, in the long term, they can cause very serious issues for the country as a whole.
Sliding Doors
To be clear — I agree in general that a country needs to protect certain critical industries in order to remain independent and prosperous, and that tariffs are one of the tools to achieve those ends.
However, this needs to be better thought out and implemented. From inauguration day till just before the tariff details announcement on 4/2, the president made around 20 tariff announcements (in around 2 months!), most of which were changed or rescinded completely within days, if not hours. And then, out of nowhere, he announces tariffs that are wildly out of proportion to their stated intent, with what many speculators are saying seems like the output of a particularly bad LLM hallucination.
At the same time, the flipflopping of tariff policies resulted in serious business paralysis. Businesses typically order their inputs months in advance. If they cannot be sure what price they’ll ultimately pay for the inputs (since payment and tariffs both apply after the goods arrive), they simply cannot make any major decisions with regards to their supply chains and operations.
Finally, it is important to recognize that it takes years to build factories and to plan out supply chains. You simply cannot impose a tariff and demand companies shift their productions onshore in order to avoid the tariffs the next day. In the short run, there is nothing a company can do about their current supply chain, so they are forced to pay the tariff, even if they want to onshore their productions eventually.
If the short term goal of the tariffs are indeed to rebuild America’s industries, I’m all for it. But we have to recognize that rebuilding America’s industries is to serve a longer term goal, which is to strengthen the nation and enrich its people. Trying to rebuild industries by creating chaos in the business and international trading landscapes, while simultaneously alienating and insulting our allies is going to isolate America while making it that much harder to do business either domestically or internationally — the exact opposite of the end goal of a strong and prosperous nation.
Inflation
As discussed in Politinomics, tariffs are inflationary. There are some who argue against this, but I believe those arguments are wrong.
Some argue that tariffs are not inflationary because if the imported good becomes more expensive because of the tariff, consumers can simply substitute with domestic goods. This is a flawed argument, because it conflates inflation with inflation measures.
A similar argument is that as foreign goods become more expensive, it’ll trigger a recession, because consumers simply cannot afford to consume as much goods. As recessions are deflationary, the argument then concludes that tariffs are deflationary. Again, I believe this is a flawed argument, for the same reason:
As mentioned in Inflations, inflation measures are very flawed, though they are pretty much the best that we have right now. One pet peeve of mine about most inflation measures is that they usually take a basket of goods at some point in time, then measure the change in prices of those goods over some period of time to compute inflation rates. Most measures use baskets based on what consumers actually buy, which seems reasonable, except that it has a “too expensive” problem.
Imagine that you are currently able to afford to eat out every meal. However, for whatever reasons, restaurants all around the world suddenly raise their prices by 1,000%, though all other goods and services remain at the same prices. After the price hikes, you no longer are able to afford to eat out at all, so instead, you cook at home, which turns out to be cheaper than eating out before the price hikes, though it is not your preference.
In our scenario above, would you say that inflation is up, down or flat? Most people would say that inflation was up, despite the fact that you are now spending less money cooking at home. However, most inflation measures that use the “basket of goods consumers buy” approach will initially register a spike in inflation (due to the 10x increase in eating out costs), until the basket of goods is updated to reflect that you no longer eat out, at which point it’ll register deflation, because now you are spending less money on your basket of goods.
Obviously, this is wrong — inflation clearly went up, the fact that you are no longer able to afford your previous lifestyle is testimony to that.
The key to remember is this — businesses are commercial ventures, they need to make a profit to survive. There is no business in the world that can survive losing money perpetually (companies that do that are called charities, not businesses, and they are funded by donations).
Now, some may claim that businesses are making so much money, they can afford to make a little less. That argument may sound correct, right up till you look at the details. Most businesses (outside of tech and finance) make profit margins of around 5-15%. Retail businesses, in particular, are famous for having razor thin margins, some as low as 1-3%. What do you think happens if you are making 10% margins, and then a minimum 10% tariff is imposed on the inputs into your businesses? 10 – 10 = 0.
Immediately after the tariffs are imposed, some businesses may be able to raise prices, while others may not raise prices for a while. For example, companies which sell mostly online tend to be able to adjust prices faster, while brick and mortar stores tend to lag because their prices are on physical price tags and it takes a while to manually adjust all the price tags. Similarly, businesses locked into long term purchase orders may not be able to raise prices due to contractual obligations.
However, in the long run, where short run considerations like price tags and time limited contracts are no longer factors, the business can, and literally must (in order to stay alive), raise their prices. These raises may be gradual or fast, depending on the industry, and they may be explicit (prices actually going up) or implicit (reduction in costs due to better productivity not being passed on to customers as price decreases). But one way or another, the business must raise its prices due to the tariffs, or they simply go bankrupt.
Possibilities
So what are the possible outcomes of these tariffs? First, I must say that I am extremely unqualified to discuss this — I have no inside knowledge of how the administration thinks, and obviously I cannot see the future. Also, all of these are extremes — I don’t think any of them will become reality in their entirety, but instead, the final outcome may incorporate aspects of each of these.
Tariff gotcha
Possibly the best possible outcome for America. The president uses the tariffs for bargaining leverage to negotiate better trading terms with the rest of the world, and the tariffs are never actually implemented, or they are only live for a very short (days) period of time.
The president, willingly or forced, retracts the tariffs without getting a deal with the rest of the world, before tariffs actually go live, or go live for only a very short (days) period of time.
The tariffed countries retaliate by imposing their own tariffs or other trade barriers, effectively engaging the trade war head on. The fight may spiral with each side escalating back and forth until one side surrenders, or some compromise is reached.
This would be seriously detrimental to the economies of both the US and the countries involved (assuming both sides are a large percentage of trade of the other). There is no winner in this situation, only a loser and a slightly less battled loser.
In particular, the tariffs currently slated to be implemented are already so high for some countries that they are effectively already cut off from the US market. This means that for them, higher US tariffs would make very little meaningful difference, so they may be more inclined to fight.
Given that many goods imported into the US have no other source of readily available producers, this would mean that US consumers will simply be deprived of those goods until new production can be started up somewhere else (or in the US itself), which can take years/decades, depending on the goods.
The worst possible outcome for the USA, would be if some of America’s largest trading partners decide to cooperate and defend against the new tariffs as a bloc. The new bloc could be used to gain leverage over the US to extract better trading terms, possibly even worse (for the US) terms than existing ones, or, much worse yet, the bloc could effectively trade amongst themselves, cutting out the US entirely.
Nobody really knows how this will all end. While some countries have stated that they will not contest the tariffs but will instead work towards a compromise, they may change their minds if other countries start getting preferential treatment. At the same time, countries that opted to fight may find the president to be unyielding, and quickly lose their appetite to continue the war.
In the end, this entire mess creates chaos in international trading, a lifeblood of effectively all large businesses and many/most small/medium ones as well. It is no wonder that the markets are treating this as a very serious event, on par with the pandemic.
For now, all we can do is watch helplessly as the leaders of the world try and secure what’s best for their nations, praying that whatever happens won’t be too detrimental for us, personally.
This is a quick note, which tends to be just off the cuff thoughts/ideas that look at current market situations, and to try to encourage some discussions.
Ben Felix, an actual financial advisor, is out with a video about sequence of returns risk, a topic that we covered somewhat in Monte Carlo.
As usual, a reminder that I am not a financial professional by training — I am a software engineer by training, and by trade. The following is based on my personal understanding, which is gained through self-study and working in finance for a few years.
If you find anything that you feel is incorrect, please feel free to leave a comment, and discuss your thoughts.
Sequence of Returns Risk
To put it simply, sequence of returns risk (or sequencing risk) is the risk that a series of bad market returns during the early years of your retirement can dramatically reduce your future purchasing power by diluting the value of your portfolio before it has a chance to grow, resulting in you having to withdraw “more expensive” money in the short term to meet day to day needs.
While Ben is right that historically, a portfolio of 100% stocks statistically works better, and that the other proposed methods of retirement planning (diversification, bucketing, safe withdrawal rate, etc.) tend to results in worse results (i.e. less money to spend) at least based on historical data, there are some points which I think he did not address:
If you are planning on leaving an inheritance to your heirs, then having more assets left over at death need not be a bad thing — your heirs just get more in their inheritance.
There is, arguably, a regime change in the financial markets recently compared to the past ~50 years — interest rates have been steadily coming down since the late 1970s to the early 2020s, but has since then broken the trend and started going up. Perhaps this is a blip and interest rates will resume going down, or they may continue going up — nobody really knows. But a diametrical change in interest rates trends can potentially have dramatic effects on how assets perform going forward.
For retirement planning purposes, you have to make some assumptions about the future in terms of rates of return, spending needs, etc. Given that for some, retirement can be a semi-permanent thing (especially for tech workers, where the probability that you’ll be hired at a salary anywhere close to what you were making pre-retirement is very low), it makes sense to use more conservative estimates to build headroom for your calculations. After you actually retire, you can choose to adjust up your spending budget if your assumptions prove too conservative.
Note that none of the points above invalidates Ben’s arguments — his arguments are still very sound. But his arguments are based on historical data, and while there’s a good chance the arguments will prove true, there is also a non-negligible chance that, well, some things may change.
Whether you want to hedge that (possibly very small) risk, or are willing to chance it, depends on your tolerance for the risk.
SPY is the first S&P500 ETF ever listed, and because of that first mover advantage, it has amassed a large number of shareholders. However, VOO, a competitor from Vanguard now beats SPY by net asset value, even though it launched much later. Should you switch?
As usual, a reminder that I am not a financial professional by training — I am a software engineer by training, and by trade. The following is based on my personal understanding, which is gained through self-study and working in finance for a few years.
If you find anything that you feel is incorrect, please feel free to leave a comment, and discuss your thoughts.
Background
SPY is an ETF that tracks the S&P500 index, and so is VOO. In practice, the ETF providers have some leeway on how they actually implement the fund, but for the most part, they have a very high correlation and most people can treat them as effectively the same thing.
However, SPY has a 9bps (0.09%) expense ratio, while VOO has a 3bps (0.03%) expense ratio, making VOO slightly cheaper in terms of fees that users pay to own the shares 1.
Because VOO has a lower expense ratio, and I believe it is one of the cheapest, if not the cheapest, S&P500 funds, it has drawn significant interest from many investors.
Expense ratio
You can think of the expense ratio as roughly “how much I pay per year to own this fund”. So for SPY, if you’ve bought $10,000 worth of SPY shares, then every year you will pay about $9 — this is done by the fund provider selling $9 worth of assets in the fund to cover your share of the fees. One way to think about it is, absent all other factors, the value of your holdings in the fund goes down by $9 per year.
Similarly, for VOO, you will pay about $3 per year if you had bought $10,000 worth of VOO shares.
So, if you bought VOO instead of SPY, you would save about $6 a year.
$6 isn’t a whole lot, but it’s not nothing. And given that there’s nothing you need to do, it seems like a no-brainer, right?
Liquidity
If it is a no-brainer, then why does SPY even have shareholders? Why don’t all investors just sell out of SPY and buy VOO instead? And why hasn’t the provider of SPY just lowered their fees to compete?
Well, the answer is that it is not that simple. It never is.
This is a screenshot from Interactive Brokers sometime this afternoon (Feb 21st, 2025) showing the prices of SPY vs VOO (edited to show the relevant bits):
As you can see, VOO has bid/ask prices of 557.68 vs 557.71, while SPY has bid/ask prices of 606.47 vs 606.48. As a simple model, let’s say the “correct” prices of a security is the midpoint price, i.e. the average of the bid and ask price. So for VOO, the “correct” price is 557.695, while for SPY it would be 606.475.
From the quotes, VOO trades with a spread (ask price – bid price) of 3 cents, while SPY trades with a spread of 1 cent. As a rough approximation, you can think of the spread as how much you pay (excluding broker and exchange fees) every time you buy and sell (i.e. one roundtrip) a share. So if you buy and immediately sold VOO, you’d pay 557.71 to buy, but only get back 557.68 when you sold, giving you a loss of 3 cents.
So, as a percentage of the “correct” price, the spread for VOO is about 0.5bps (0.00005%), while the spread for SPY is about 0.2bps. In other words, if you trade in and out of both SPY and VOO, you’d pay about 3x more for the trades due to the spread for VOO, than for SPY.
In concrete terms, if you buy $10,000 of SPY, you’ll pay in spread about 8 cents (0.01 * (10000 / 606.475) / 2), while for VOO, you’ll pay about 27 cents (0.03 * (10000 / 557.695) / 2). Note that divide by 2, because we are only buying and not selling, so we “pay” half the spread2. Or, if you trade in and out of either position, you’ll pay 16 cents for SPY and 54 cents for VOO.
Given these numbers, if you trade in and out of your position 16 or more times a year, then it would make more sense to trade SPY than VOO — even if you hold the position everyday at the end of day, and thus pay the full $6 additional fee for holding SPY, you’ll more than make up for that by paying less in spreads when you trade — (54c – 16c) * 16 = $6.08.
If you don’t even hold the position at the end of every day, then trading SPY will come out further ahead, since you will pay a smaller fee to the provider (as a ratio of how many days you actually own the position out of the year).
16!
“But I’m a buy and hold investor”, you say, “I’m not going to trade in and out 16 times a year!”
And that is very true. Most people do not turn over their entire portfolio 16 times a year.
But that’s just one part of the liquidity story.
Here are some screenshots (again, edited for focus) of options expiring on March 21st, 2025 for SPY:
and VOO:
As you can see, an at the money call option for SPY trades at 9.17/9.20 bid/ask, while a similar at the money call option for VOO trades at 7.40/7.80 bid/ask.
As a percentage of the “correct” price per share, the SPY option has a spread cost of about 0.5bps, while the VOO option has a spread cost of about 7bps, an order of magnitude higher.
Which is to say, if you, like me, like to occasionally sell calls against, or buy puts to protect your S&P500 position, just buying 2 rounds of puts (or selling 2 rounds of calls) per year will result in SPY being a better vehicle for your portfolio — You’d pay roughly 6.5bps higher in spread costs to buy 2 rounds of puts (or sell 2 rounds of calls), if you let the options expire (i.e. you only pay the half the spread cost per trade), if you had used VOO instead of SPY (edit: for clarity).
While I don’t really trade that much, I almost definitely sell more than 2 rounds of calls per year on my holdings to juice my returns when I feel that the markets are especially richly valued, so for me, personally, trading SPY is usually a better idea.
Summary
While it is true that holding VOO is cheaper in terms of fees paid to the fund provider, be careful of all the other costs of investing. The 6bps you save per year by holding VOO instead of SPY is easily eroded if you trade options or the underlying even semi-frequently.
Of course, if you are a pure buy and hold investor who holds for the long term, then as of right now, VOO does indeed seem to be a no-brainer.
Footnotes
Users don’t actually get a bill or send money — the ETF provider just sells some of the assets of the fund to pay itself. ↩︎
Experienced traders will know that you can actually buy and sell closer to the midpoint than the spread, but that’s a story for another time. ↩︎
This is a quick note, which tends to be just off the cuff thoughts/ideas that look at current market situations, and to try to encourage some discussions.
As usual, a reminder that I am not a financial professional by training — I am a software engineer by training, and by trade. The following is based on my personal understanding, which is gained through self-study and working in finance for a few years.
If you find anything that you feel is incorrect, please feel free to leave a comment, and discuss your thoughts.
Monetary policy is a set of actions taken to control the money supply, typically via interest rates policies and/or reserves requirements of banks. These are typically done by a country’s central bank.
Fiscal policy is the set of actions taken to control the cash flow of a country’s government, e.g. via public spending and taxation policies. These are typically done by the government of a country.
To put it somewhat crudely, monetary policy determines how easy it is to borrow money. It doesn’t mean that anyone actually has to borrow the money. Fiscal policy, on the other hand, determines how much money is coming in or going out of the government’s coffers, and if there is a deficit (i.e. more money going out than coming in), then the balance needs to be borrowed.