This is a quick note, which tends to be just off the cuff thoughts/ideas that look at current market situations, and to try to encourage some discussions.
Recently, there has been a lot of talk about bubbles, and bubbles bursting. This is despite the fact that we are about 15% below all time highs for the SPX, and 6% above recent lows. It is getting scary out there…
As usual, a reminder that I am not a financial professional by training — I am a software engineer by training, and by trade. The following is based on my personal understanding, which is gained through self-study and working in finance for a few years.
If you find anything that you feel is incorrect, please feel free to leave a comment, and discuss your thoughts.
Sequoia
In 2008, Sequoia made the, then controversial move of publishing a slide deck titled “RIP Good Times”. Despite the events of late 2007, no major financial entity was publicly talking about dramatic economic hardships at the time, and the Fed then was still publicly optimistic.
As we now know, those slides turned out to be prescient, almost perfectly marking when the Great Financial Crisis really started in earnest, eventually resulting in the SPX dropping around 50% peak to trough.
Recently, Sequoia is out with another note, this time in a medium more fitting of the times, “Adapting To Endure”. While the title is less punchy and doomy than the deck in 2008, the contents aren’t exactly encouraging.
Wealthion
A relatively recent entrant to the financial news scene, Wealthion has grown fairly rapidly, with insightful interviews of various prominent financial scholars.
Clearly, the titles are less than optimistic, and the content matches the mood set.
Well then…
I would strongly encourage everyone to read Sequoia’s latest note. If nothing else, it gives some ideas for how one would prepare for potential future financial hardships.
The videos from Wealthion are also worth the time. They give a brief history of how we got to where we are, and highlights something I’ve been talking about on and off — price discovery doesn’t seem to be working well, especially since the Great Financial Crisis; With the dramatic rise in stock valuations in the past ~20 years, and despite the recent drop in stock prices and the dramatic earnings improvements of the past ~10 years, the P/E ratio of the S&P 500 is still about 30% higher than the average pre-dotcom.
Nobody really knows what the future will bring, so take the above with a pinch of a salt. They aren’t meant to be predictive, nor prescriptive. Instead, they suggest that at least in some parts of the economy, some people are starting to take note and they seem worried.
Unless you are extremely lucky, building wealth will likely be a long term process, something you work towards over long periods of time, possibly your whole career.
Once you’ve built your wealth, retaining it will require just as much, if not more effort. Without the discipline to control your budget, invest wisely and manage your risks, whatever wealth you may have built, can easily be squandered away.
As usual, a reminder that I am not a financial professional by training — I am a software engineer by training, and by trade. The following is based on my personal understanding, which is gained through self-study and working in finance for a few years.
If you find anything that you feel is incorrect, please feel free to leave a comment, and discuss your thoughts.
Expected returns
Let’s say there is a game, where you have to bet your entire liquid net worth every turn, but the expected return to whatever you bet is 10% (i.e. the expected value of a $1 bet is $1.10). Would you play this game? And if you would, how many rounds would you play?
Given the positive expected returns, I’m guessing a large number of people will play at least one game, and a good number of people will play until they are rich enough to retire.
What if I say that every turn, you have a 99% chance of winning 11.11% of your bet, and a 1% chance of losing everything (expected return is still 10% per turn)?
I’m guessing that most of those who would play at least once, will still play at least once, but most people will only play a relatively small number of games, somewhere in the 1-50 games range, certainly not enough to let most people retire.
What if every turn, you have a 1% chance of winning 110x of your bet and 99% chance of losing everything (expected return is still 10% per turn)?
I’m guessing close to nobody would play the game now.
The key to remember here is that positive expected return is not nearly enough information to determine if something is a good bet. Volatility of returns is important too!
The longest race
From the day you start accumulating wealth, to the day you pass from the world, the need for financial discipline is constant — it is the race that never ends, until you literally do.
If you become fabulously wealthy, then yes, you can probably be more reckless and still get away with it. But not too reckless! History is replete with famous rich people who manage to gamble away unimaginably large fortunes.
But no matter if you have $500k saved for retirement or $5b, the fact remains that you need to maintain some financial discipline. Simply betting your entire liquid net worth on a lark is probably not a winning strategy!
If you are making a one time risky bet, you may certainly get lucky — even better if the odds are in your favor. But no matter how small the chance of ruin, if you keep making that same bet, and if every single bet is an independent event and thus has the same odds, then that small chance of ruin will eventually catch up with you — the law of large numbers practically guarantees it.
It is with this in mind, that I view with horror at how some people are betting large portions of their net worth on options. Yes, in the short run, you can quickly grow your money by a few multiples, maybe even a few orders of magnitude — as long as you remain lucky. But once your luck runs out, one bad bet can easily ruin you. To make matters worse, buying options generally has negative expected returns — options are generally priced such that options sellers have positive expected returns, while buyers have negative expected returns.
Viable strategies
That’s not to say that risky bets are totally off the table. The crux of the matter is that the event of ruin, no matter how unlikely, will eventually occur if we tempt fate enough times. So, naturally, the strategies to counter involve trying to reduce or completely remove the chance of ruin.
For speculative bets, including investments that have gone beyond rational exuberance, taking some profits off the table gives you cash to redeploy as and when the markets regain some sanity.
Buying insurance
Insurance in the financial markets tend to be expensive, but if you have a position that has a large chance of ruin, it may make sense to buy some insurance against that event. For example, if your portfolio is heavily concentrated in technology stocks, it may make sense to hedge that exposure by buying puts against QQQ.
Rebalancing, position sizing
A combination of taking profits and diversification, regularly rebalancing your portfolio and making sure the value in each position is a limited part of your entire portfolio will ensure that no single blow up will wipe you out.
Marathon
At the end of the day, it is important to recognize that getting “there” and staying “there” are two sides of the same coin. It is a journey from the first dollar you make, to when you are laid to rest. It is a marathon, and you need to treat it as such — making rational, long term decisions, instead of trying to bet the farm on random whims.
This is a quick note, which tends to be just off the cuff thoughts/ideas that look at current market situations, and to try to encourage some discussions.
A long time ago, before the creation of this blog, I used to write semi frequent, though not really regular, short notes about what I think about the markets in the near term. That was the model for the “quicknotes” posts in this blog.
A couple of people reached out and mentioned that they missed the discussions around those posts, and were also curious about my take on the market’s behavior so far this year. And so, here we are…
As usual, a reminder that I am not a financial professional by training — I am a software engineer by training, and by trade. The following is based on my personal understanding, which is gained through self-study and working in finance for a few years.
If you find anything that you feel is incorrect, please feel free to leave a comment, and discuss your thoughts.
Powell
Before we discuss more, we need to talk about my mental model of Powell. Personally, based on his words and actions I think that Powell leans towards the hawkish side of the Fed (I can’t substantiate these, as I’m lazy, deal with it):
He was on the record in favor of hikes when Yellen was chair.
He hiked in 2018, despite the markets going down.
He mentioned Volcker a lot in his speeches. Less so Greenspan.
Now, some people are very quick to point out that Powell blinked and reversed course in 2018, stopping the hikes after the markets turned down. That’s partially correct — he did do that, but I don’t believe he did it willingly.
If you’d recall, (then president) Trump was very upset about Powell hiking, and repeatedly bashed Powell in public, press conferences, Twitter, etc. He also repeatedly threatened (and was rumored to be exploring options) to fire Powell before Powell’s term was up. It was only after a long time of this abuse did Powell relent.
Imagine if your boss, and the president of the United States wanted you to do something, but you did something else instead. And only after being threatened did you relent. Would you be stopping willingly, or not?
From all these, it seems to me that Powell is a pragmatist, a technocrat. He recognizes that low interest rates forever is not a good thing as it distorts markets (1), and he’s willing to let the market take a hit to restore balance.
Federal Reserve
The Federal Reserve (Fed) as an institution has only 2 official mandates — price stability and full employment.
We are currently very near full employment (some may argue too high, given the labor shortages). But we have very high inflation, i.e. no price stability.
When I wrote my first inflation note, I had already seen early signs of inflation for a few months, which was why I was fairly confident that the Fed would have seen it too and would act soon. I mean, if a code monkey like me can see it, anyone who wasn’t blind could… right?
I figured that since it was early, if the Fed stepped in quickly, they could probably get away with just jawboning and maybe 1 or 2 symbolic hikes.
By September 2021, when the Fed still hadn’t acted, despite inflation being super obvious and already reflected in CPI numbers, I decided to flatten my portfolio (2). My thinking then was, the stock markets already seemed to be starting to price in some action from the Fed, despite nothing from them, so everyone must be seeing it. The fact that the Fed aren’t acting yet means that the problem is more likely to get out of hand, which then makes it that much harder to control — recall in my first inflation note that beyond some point, inflation becomes really hard to control without draconian measures (hence the Volcker policies of the 70s). I didn’t like the odds for the market, and so I tamped down my exposure.
At this point, inflation is so high that the Fed cannot simply jawbone it down, neither can they (I believe) just get it down with a few symbolic hikes. At the same time, inflation is so high that they cannot claim “mission accomplished” just by changing the trajectory of inflation (i.e. disinflation) — no, it’s too late for that now — to restore public confidence, it seems like they’ll need to get the absolute level of inflation down to some reasonable level, say 2-3%.
Biden
Finally, the last piece of the puzzle. Recall that in 2018, when Powell wanted to hike, Trump stopped him so as to bolster the stock markets. Well, will Biden do the same if stocks go down?
First of all, Trump was an unconventional president. Biden is quite a bit more conventional. And conventionally, presidents tend to avoid overtly influencing the Fed.
Secondly, Biden is on the record as saying that he believes inflation is too high. Indeed, inflation is currently seen as the most important topic for the midterm elections later this year.
Finally, Biden has expressed that he believes the Fed will tame inflation. I’m not much of a politician-speech expert, but I think that means “Powell, you’re it! Please get inflation down, kthxbai.”
Which is to say, Biden seems like he’s more concerned about controlling inflation, than about stock markets taking a beating or two.
Now what?
Currently, it seems like the 3 entities most able to control the inflation vs stock markets balance are all leaning towards “taming inflation”. Maybe they’ll be able to find a soft landing, maybe not. I don’t know.
Either way, it does suggests that volatility is here to stay for a while.
For reference, historically, the trough of the S&P500 tends to occur when its P/E ratio is from 5-15, or 18 (for the Dotcom bubble): https://www.multpl.com/s-p-500-pe-ratio (3)
A P/E ratio of 5 for the S&P500 implies SPX at around 989. 15 implies 2968 and 18 implies 3561.
I’m guessing the truth is somewhere in there.
Footnotes
Since it’s mid May 2022, I’m guessing most people have gotten this memo by now.
“Flatten” here meaning reduce risk, not “sell everything”.
This is a quick note, which tends to be just off the cuff thoughts/ideas that look at current market situations, and to try to encourage some discussions.
As usual, a reminder that I am not a financial professional by training — I am a software engineer by training, and by trade. The following is based on my personal understanding, which is gained through self-study and working in finance for a few years.
If you find anything that you feel is incorrect, please feel free to leave a comment, and discuss your thoughts.
Almost anniversary
Almost a year ago, on June 6th, 2021, I made a post about inflation. In it, I talked a bit about my thoughts on inflation, where I think it was heading, and some potential sectors to invest in if you believed inflation was going to be a problem. I made a follow up on August 30, 2021, clarifying some misunderstandings I hear from talking to people.
Unless you’ve been hiding in the middle of the forest and living off the land, you’ll probably have noticed that inflation has not been kind in the past “almost a year”:
And this is how the sectors I’ve talked about have performed:
Sector performance vs SPY. Source: Interactive Brokers Trader Workstation
Notes:
The candlesticks are for SPY, the colored lines are each for a sector ETF.
I’m cheating a little by using XLU. I wasn’t talking about the utilities sector in my prior posts, but “utilities-like” stocks (see the posts for clarifications). But there’s no real “utilities-like” stocks ETF, so I’m using XLU to represent.
Some people were confused when I say “housing”, thinking I meant “homebuilders”. No, I meant “housing”. Homebuilders didn’t do too well was what I gathered.
ARKK isn’t really a sector, but a bunch of people have been crowing about how “innovative, disruptive tech” is the best inflation hedge. Yeah…., no.
This is a quick note, which tends to be just off the cuff thoughts/ideas that look at current market situations, and to try to encourage some discussions.
As usual, a reminder that I am not a financial professional by training — I am a software engineer by training, and by trade. The following is based on my personal understanding, which is gained through self-study and working in finance for a few years.
If you find anything that you feel is incorrect, please feel free to leave a comment, and discuss your thoughts.
Curve inverted
Historically, when the US Treasuries yield curve inverts, such that 2 year Treasuries have a higher yield than the 10 year Treasuries, recession very often follow within about 18 months. Therefore, you can imagine the concern in various financial forums when the 2/10s inverted late last week, and the inversion got even worse (2 year Treasuries yield – 10 year Treasuries yield became bigger) this week.
Separately, the thinking is that the Federal Reserve generally has greater control over the short end of the curve (i.e. the Fed can influence 2 year yields more than they can influence 10 year yields). Hence the inversion suggests that the Fed may have to stop their rate hiking cycle before it really got out the door, for fear of making the inversion even worse.
Brainard to the rescue
Today, Lael Brainard, Biden’s proposed vice chairperson of the Federal Reserve, also historically one of the biggest doves (in favor of lower rates) in the Fed, made a speech. In that speech, she shed her dovish skin, and made the case not just for greater rate hikes, but also for faster Quantitative Tightening (QT), possibly as soon as early May.
Conventional wisdom (as covered above) would suggest that such hawkishness from one of the traditionally more dovish members of the Fed, and also someone with considerable influence due to her pending appointment to vice chair, would cause rates to rise, and the inversion to get worse.
Conventional wisdom was half right. Yields across the curve jumped around 10bps (0.1%), but the curve un-inverted. 2 year Treasuries are now yielding less than 10 year Treasuries, albeit by a tiny amount (about 2 bps) — 10 year yields jumped more than 2 year yields due to Brainard’s speech.
What would the Fed make of this, I wonder? And how would they react? Would they be encouraged to hike even faster?
Let me introduce you to the latest, and greatest new investment opportunity! It is a disruptor in the space of retail and ecommerce, growing its business at the unprecedented rate of 50% per month! Sales grow entirely linearly with investment into the business — this is basically an infinitely scaling sales machine!
As usual, a reminder that I am not a financial professional by training — I am a software engineer by training, and by trade. The following is based on my personal understanding, which is gained through self-study and working in finance for a few years.
If you find anything that you feel is incorrect, please feel free to leave a comment, and discuss your thoughts.
Sales metrics
Before I tell you more about this incredible business, let me first throw out some numbers:
Age of company
2 years
TTM annualized revenue
$1 billion
MoM sales growth
50%
YoY sales growth
110x (that’s 11,000%!)
Total investment raised
$500 million
Valuation assuming 2x FTM P/S
$220 billion
Unrealized gain for existing investors
440x (that’s 44,000%!)
Sounds wonderful doesn’t it! 440x returns! In 2 years!
Imagine if we scale the business for 2-3 more years, before tamping down on customer acquisition spend to ramp up profits!
Would you invest in our business?
Problematic numbers
If you looked at the numbers, and immediately noted that:
The valuation is based on FTM P/S (forward twelve months price/sales ratio),
The valuation assumes that the business will grow at the same incredible rate of 110x in the next year,
That rate seems unsustainable,
then give yourself a pat no the back! Yes, those numbers do seem incredible, and in a regular business, would almost definitely be unsustainable — any $1B business that grows at 110x a year would be doing more business than the world’s combined GDP in the span of about 3 years, and clearly that has not happened.
But what if I told you that I can guarantee the business will grow by 110x or more, as long as we continue investing in it? Would you buy into the business now?
Doing business
Hopefully you said no — because up till now, you still have no idea what the business actually does!
To be honest, the business is a very simple direct to consumer sales, with some very large B2B customers. We sell $1 US dollar notes, for 50c. That’s it. We’re, literally, a half-off dollar company.
Now that I’ve revealed the secret, can you see why I say the business metrics are real? And that we can definitely grow 110x or more per year, as long as we keep investing in the business?
But would you invest in this business?
Terrible business
There are no lack of businesses nowadays whose sole focus is to grow revenue at all costs. Many of them sustain massive losses while they “scale the business”, with the hope that at some point, they’ll be able to reduce the cash burn somehow, and thereby turning profitable.
To be fair to these companies, there are some truths to the basic idea. When a company is first starting up, it will not have a lot of economies of scale, so it tends to need to spend more to manufacture its products. At the same time, the company needs to spend on advertising and have other customer acquisition costs (such as retention, etc.). These costs tend to level out once a company has reached sufficient scale,.
However, some companies take the basic idea and push it to extremes which no longer make sense. For example, our half-off dollar company has basically no hope of ever turning profitable — any attempt to sell that dollar for more than $1 will immediately lead to complete customer base loss.
In other cases, the scale required by the business to be profitable would require the business to have more customers than there are people on Earth. Perhaps they have some insights into alien civilizations that I am not privy to, but this business model also seems suspect.
And in yet other cases, the business is in a commodity space (here “commodity” meaning “easily copyable” as opposed to actually trading physical commodities), and the moment the business stops spending on customer acquisition and retention, their customers will quickly be stolen by any competitors that are still spending on customer acquisition. Businesses like these are basically just racing each other to the bottom. Yes, maybe one of them will eventually crowd out the competition and win the race, but by then, the business would likely have burned so much cash that it may never return a sufficient return to investors. Even more condemning, the eventual winner may not be the one you actually bet on!
Before making an investment in a (currently) money losing business, it is imperative to figure out if there is actually a plan to profitability, and to then vet that plan for feasibility. Otherwise, you aren’t investing, you are making charitable donations for the benefits of the company’s employees.
Numbers game
When vetting such companies, you need to be careful, and think critically of the numbers presented. At a minimum, the gross profit (revenue – costs of goods sold) should be positive, or at least becoming less negative over time. This would indicate that the business is not simply selling products for below costs to attract customers — businesses selling products at below costs, like our half-off dollar company, often find that when they try to raise prices to become profitable, customers tend to leave.
Next, you need to verify that both operating and non-operating expenses are not growing faster than revenue. These are supposed to be “fixed” costs, and if they are moving linearly (or worse, super-linearly) to revenue, then something is very wrong indeed! Either maliciously or not, there is a chance that the business is classifying some costs of goods sold as operating/non-operating expenses. You need to figure out what’s going on here, before investing, and as before, understand the plan, and the feasibility of that plan, for reducing expenses in the future.
Finally, you need to then figure out if the company’s projections for when it’ll be profitable is reasonable. If the business needs to have 10billion active customers to be profitable, then run away as fast as you can! Or somehow figure out how to create 2billion humans out of thin air(1).
Total addressable market
One sneaky trick that needs special mention, which many companies like to pull, is to talk about TAM, or total addressable market. This is the amount of total potential sales that the company estimates is in its industry, and is often thrown around, conflated with “potential future sales of the company”.
The 2 main issues with TAM are:
It is an estimate. There are no guarantees that it’s anything near to reality. Especially for new (disruptive!) industries, the number is often just a random pie-in-the-sky figure the company’s management dreamt up.
It is imperative that TAM claims are thoroughly researched by the investor to make sure they actually make sense. Or just ignore them completely.
TAM is the total potential sales of the industry. What makes management think they’ll be the sole company in the industry? Or that they’ll even be in the top few by sales?
The TAM of the global cooked food industry is huge, and my random estimate puts it in the $1 trillion range per year. But that number is for the entire industry worldwide, and since different regions of the world have different preferences for food, it is unlikely that any single company will ever gather more than a small fraction of that TAM.
So, if a brand new fast food startup comes to you, and starts throwing the TAM of global cooked food industry around, trying to implicitly hint that they’ll grow to that size, your only reaction should be to laugh, politely excuse yourself, and find something else to occupy your afternoon.
In short, any company that brings TAM into the conversation should also provide:
Verifiable research into how they come up with that number.
How much of that TAM they actually believe they can address (in general any number more than 50% is highly suspect).
What plans they have for achieving that portion of the TAM.
You’ll be excused for thinking the stock market is schizophrenic the past few weeks — one moment it is down, the next it is up, and often on the same day!
In an environment like that, how should the rational investor price stocks?
As usual, a reminder that I am not a financial professional by training — I am a software engineer by training, and by trade. The following is based on my personal understanding, which is gained through self-study and working in finance for a few years.
If you find anything that you feel is incorrect, please feel free to leave a comment, and discuss your thoughts.
Magical pot of cash
Let’s say you have a magical pot of cash, where every 3 months, an additional $2.50 appears in that pot of cash, and you know this, because the pot is transparent and you can see the money actually in it, and count it.
However, the pot is completely sealed, and there is no way to get at the cash unless you break the pot. Unfortunately, breaking that pot will mean that it no longer generates that additional $2.50 every quarter.
If the pot currently contains $100. How much do you think you can sell this pot of cash for?
Well, if the buyer is rational, they’ll pay at least $99 for it — if nothing else, they can buy the pot for $99, break it and immediately make a $1 profit.
But what if the buyer only has $50? Clearly they won’t be able to pay more than $50 for the pot. And so that’ll be the maximum they’ll be able to bid. Remember, a transaction can only happen when the buyer is willing and able to afford the trade.
Secondly, let’s say the buyer has $150, but anticipates needing that $150 in 2 years. Well, the maximum they would be willing to pay for the pot is $120 — if they pay $120 for the pot, in 2 years, it’ll grow to $120, and they’ll be able to break it to take that $120 out, combined with the $30 in cash they’ll have remaining, they’ll be able to just meet their $150 obligation. Obviously if they want to make a profit, they’ll likely want to spend less than $120 for the pot, but $120 remains the upper bound.
Next, let’s say the buyer, for whatever reasons, feels that starting next quarter, the pot will grow by $5 a quarter instead of the current $2.50. Well, in this case, even if they still only have that $150 and still need that $150 in 2 years, they may be willing to pay up to $140 for the pot — they believe the pot will grow $40 in 2 years, and with the $10 in cash left, they’ll be able to meet their obligations. The buyer may be right, or they may be wrong — maybe they know how the pot actually works, maybe they consulted an Ouija board, or maybe they simply read some anonymous stranger make the claim on Reddit. Either way, that’s their belief, and they are willing to act on it.
Finally, let’s say the buyer has infinite money. In this case, they clearly aren’t worried about liquidity issues, and they may be willing to pay absurd amounts of money for the pot! Even if they pay, say, $1,000 for the pot, they’ll break even in 90 years and anything beyond is pure profit. And they’ll be willing to wait 90 years, because they have no immediate need for the money anyway.
Sentiments
To put it in more general terms, the amount that the buyer is willing to buy your pot for, is based on their personal situation and what they feel the future portends. In a single word, it depends on their sentiments — how and what they feel is going to happen in the future. The fact that the pot generates a stable flow of additional cash is relevant, but orthogonal to how much they are willing and able to pay for the pot.
Stocks
Now, to bring the discussion home — a share is basically just a representation of fractional ownership of a company. If we assume that the company is run by competent managers who are honest (i.e. no fraud), then the company’s business will generate profits over time. The company may or may not pay dividends, and for the sake of simplicity, we’ll assume it does not, in which case, the profits simply accrue on the books of the company forever, either as cash, product inventory, equipment or other assets.
Given that the company does not issue dividends, the average investor has no way to readily access those profits. Like our magic pot, the investor can only watch the profits accrue on the books of the company. However, our investor does have the option of selling their shares.
At the same time, a wealthy enough entity can also buy out the entire company, at which point that entity can then sell the company for its parts and get at the accrued profits, essentially “breaking the pot”.
Profit accrual
The fact that profits accrue on the books of our company is crucial — the company is a productive asset, and so buying and selling shares of that company is not a zero sum game; This is a positive sum game, because the accrued profits are an external injection of “value” into our system.
However, as we’ve discussed before, just because a company is profitable and well run, does not mean that buyers are willing and able to pay up for it. In different periods of time, people may value the same dollar of profit differently.
This may be due to demographics — an economy of retirees may have a shorter time horizon and thus less willing to pay for future profits, while an economy of twenty-year-olds may be more willing to pay more for future profits.
It may be due to political factors — in times of war, physical assets may get destroyed, which may cause losses to the company.
It may be due to irrational reasons — a group of investors who are collectively financially significant may decide to buy up shares of a company for no real reasons other than because “they like the stock”, etc.
In short, the price for each dollar of profit that a buyer is willing to pay (e.g. P/E ratio) changes based on sentiments, mostly orthogonally with the actual performance of the company.
Investing for profit
To profit as an investor, it is thus important to understand that the price paid for each dollar of profit is not a constant, and the market can and do over or under value that dollar of profit at different times. The intelligent investor should understand this, and treat the market as the proverbial irrational neighbor, who comes every day with a different price they are willing to buy or sell the shares our investor is interested in.
As long as the company remains profitable and well run, then the most profits can be made by buying when the market is irrationally valuing its shares at a low price. Similarly, our investor condemns themself to poor future investment returns if they buy the company’s shares at irrationally high prices — the accrual of profits by the company is generally independent on how high the shares for that company trade for.
That’s not to say that you should never buy shares of a company that are clearly overvalued. Just because you cannot make a decent investment return, does not mean that you cannot make a great speculative return! After all, just because you are a fool, does not mean that someone else won’t be a Greater Fool.
Stocks are on sale, with almost all stocks down at least 5-8% from all time highs, with some tech stocks down as much as 80-90%. Is now a good time to buy?
As usual, a reminder that I am not a financial professional by training — I am a software engineer by training, and by trade. The following is based on my personal understanding, which is gained through self-study and working in finance for a few years.
If you find anything that you feel is incorrect, please feel free to leave a comment, and discuss your thoughts.
Stock for sale
Let’s say you are looking at a stock to buy. A month and change ago, it was selling for $100 per share, and today, it’s selling for right around $50 a share — a 50% discount in just over a month. Would you buy it? Is it a great deal?
If the stock just gets back to where it was, you’ll double your money!
Bread for sale
Let’s say a bakery opens for business, and starts selling loaves of bread at $1.50 per loaf (1). One day, out of the blue, it starts offering to sell the exact same loaves of bread for $0.75 per loaf. Would you buy it? Is it a great deal?
Competition
Now, let’s say the first bakery returns its pricing to $1.50 per loaf. And another bakery opens offering to sell the exact same loaves of bread for $100 a loaf. It gets little business, and so decides to pull the same trick, offering the same loaves of bread for $50 a loaf. Would you buy it? Is it a great deal?
Monopoly
And finally, in our last scenario, let’s say the first bakery moves out of town, and the only bakery left is the one selling loaves of bread for $50 a loaf. Would you buy it? Is it a great deal?
Price vs Value
Price is what you pay for something. Value is what you get out of buying that something. These 2 measures are related, but separate. You can easily pay way too much (price) for way too little (value)!
So, considering our bakery scenarios –
Buying a loaf of bread at $0.75 per loaf? Yes, I believe that’s a great deal.
Buying a loaf of bread at $50 per loaf when the next door bakery is selling it for $1.50? No, that’s a terrible deal, even if it was discounted 50% from the original $100.
Finally, buying a loaf of bread at $50 when its the only bakery in town? Maybe! If there is no other food around, and I desperately need to eat, I’d certainly pay $50 (if I had it!) for a loaf of bread. But if there were other food in town, I’d probably eat something else.
In all 3 scenarios, the prices I pay for the same loaf of bread changes, but the value I get — a full tummy, remains the same. Whether the value justifies the price depends entirely on my circumstance. For example, even in the first scenario, where loaves were selling for $0.75, while I would probably buy the first and maybe second loaves of bread, I probably wouldn’t buy more than that — bread is a perishable product, and once my tummy is full, there’s not much value in more bread, to me.
Stock? For sale?
So what about the stock going for 50% less per share? Is it a great deal? Well, it depends!
If you believe in the efficient market hypothesis, then one way of thinking about it is: the stock was fairly priced at $100 a share. So, $50 a share should be a great bargain. Right?
If that’s the gist of your reasoning, then consider this — if the market was indeed efficient a month ago, what makes you think the market isn’t efficient now? Why couldn’t stocks be fairly priced at $100 a share a month ago, yet still be fairly priced at $50 a share today? Maybe something has changed to justify the stock being 50% lower!
If you don’t believe in the efficient market hypothesis, then why do you think a 50% discount, from some arbitrary value to another arbitrary value, means that stocks are a bargain now? Maybe like the $50 loaves of bread, stocks are still overpriced?
Value of a stock
There are two main ways to make a profit from stocks — investing vs speculating. When you invest, you are looking to make a return based on the productive capacity of the stock. So whether the stock is cheap or expensive depends on 3 things only:
How much return you expect to get from the stock for each dollar invested.
How much this return increases with time.
How much return you would like to make, for each dollar invested.
The first is generally measured by metrics like the P/E ratio, P/S ratio, etc. The second depends on your projections and expectations for the business represented by the stock. The third, and arguably the most important, is entirely a personal preference — some people expect to earn at least 8% per annum from their investments, while others may demand as high as 20%, or higher!
For example, if you’d like to make at least a 20% annual profit per dollar invested, and you don’t expect the business to improve, then investing at any P/E more than 5 simply does not make sense.
Separately, when you are speculating, you are looking to buy an asset at a price that is lower than what you’d expect someone else is willing to pay for the same asset, perhaps at a later time. In this case, the only 2 things that matter are:
Your projection of what that someone else would be willing to pay in the future.
How much return you would like to make for each dollar invested from now until then.
For example, if you expect someone is willing to pay $100 a share in a month, and you’d like to make a 100% return in one month, then yes, buying at $50 today may make sense.
You can always sit on your hands
The basic fundamental truth is that it doesn’t make sense to buy any asset at a price which you do not like. If you think an asset is too richly priced, even after a 50% or even 90% drop, and you don’t feel that you can make a sufficient return to justify your time and resources, then you can simply sit on your hands and do nothing.
Of course, this assumes that you have other uses for your resources, such as other investment/speculation avenues, or perhaps you think prices will get even better in the near future.
If you have no other avenues to deploy your resources, and you do not feel that prices will get better in the near future, then perhaps your expectations for returns are simply too high.
Footnotes
$1.50 is roughly the average cost of a loaf of bread in 2021, in the USA.
How do business ventures get funded? Who’s paying for the overhead when the company is first starting out and has no revenue? And what do they get out of this?
As usual, a reminder that I am not a financial professional by training — I am a software engineer by training, and by trade. The following is based on my personal understanding, which is gained through self-study and working in finance for a few years.
If you find anything that you feel is incorrect, please feel free to leave a comment, and discuss your thoughts.
Decent proposal
Let’s say you have a fantastic new business idea, but to get the business started will require $50,000 right now, which you do not have. How could you fund your new venture?
Traditionally, there are 2 main avenues:
Take a loan from a bank
Take on some partners who have deeper pockets (i.e.: sell a portion of your new company)
The former is also known as debt financing, and the latter is equity financing.
When you take on debt, you agree to pay the lender some amounts of money on some fixed timeline. For example, 1% of the loan amount every month (interest payment), and then 100% of the loan amount at the end of 10 years (principal payment).
When you take on partners, they share in the profits (or losses!) of the entire enterprise. So, if after paying off all your bills (which may include debt payments), you are left with $1,000 to distribute between the partners, then you and your partner can(1) get up to $1,000 in total. Who gets how much depends on your partnership agreement, as well as how much of the company each of you own.
First come, maybe not first served
Who gets how much money, and when, is one of the 2 central differences between debt vs equity financing.
Debts must always be paid back, on the timeline agreed upon when the loan is taken out. If you fail to make even a single payment on the debt, it is technically in default, and may officially be in default after some grace period. At that point, the lender generally has some set of rights they can exercise, up to and including forcing you to give up ownership of your company to them.
Equity partners, on the other hand, generally have no fixed payments due. A company can very well never return a single cent to the equity partners! The main considerations are the partnership agreement(2), which will detail how any payments, if made, will be distributed amongst the partners, and fairness — in general, in the absence of any details about how profits are shared, then all dividends will be made pro rata, i.e.: if each of the partners own 50% of the company, then every dollar distributed will see 50c go to each partner.
One way of thinking about this, is that debt investors have the first dibs on revenue generated by the business. Once all debt payments are made, and all other costs are paid, whatever is left over (which may be nothing, or even negative — a loss) can be distributed to the equity partners. In exchange for this “seniority” in terms of payment, debt investors typically settle for a smaller and shorter-term profit — interest rates are generally much lower than what the business can be expected to return over the long term.
Control your enthusiasm
The other central difference between debt and equity financing is that of control, or rather rights — who has rights to do what with the company?
Debt investors generally have no rights on the company other than their regular payments (sometimes known as coupons). If, however, a payment was missed for long enough that the company is in default of the loan agreement, then debt investors generally have additional rights to recover their investment, such as forcing the equity partners to give up ownership of the company, or forcing a sale of the business to 3rd parties to repay the loan.
Equity investors are generally split into 2 groups — the general partners(3) who oversee the actual running of the company, and may even be personally responsible if the company goes bankrupt, and the limited partners, who generally provide the funding for the business, but otherwise have no say in the day to day running of the company.
Mix ‘n match
When you think carefully about it, debt investors and equity investors are very similar at a very high level. Each of them:
Provide capital for a company …
… and, in return, receives some promise of cash flow at a future time, …
… along with some rights with regards to the company.
And at this abstract level, it shouldn’t be surprising, then, to learn that the tradition little boxes that debt and equity investors fit in, are not nearly that clean cut in practice.
In practice, an investor in a company is labeled debt or equity based mostly on their rights to call an event of default on the company. If an investor can call an event of default on the company when their promised distribution is not received, then they are typically labeled debt investors. Otherwise, they are an equity investor.
Some examples, in order of decreasing priority when profits are being distributed (i.e.: an investor at a lower row is not paid, until all investors in higher rows are paid according to the agreement):
Senior debt
Typically the highest priority of debt investor. All coupons of senior debt must generally be paid, before anyone else sees a single cent.
Due to this priority, senior debt is typically much safer than all other tiers of investors, and in many cases, senior debt investors may even have collateral — assets owned by the company which the investor can seize if the loan is in default.
In exchange for these protections, senior debt tends to have the lowest interest rates (i.e.: the lowest returns).
Mezzanine debt
Not often seen, except in very large projects with huge capital requirements.
Mezzanine debt are paid after senior debt, but before all else. In most cases, mezzanine debt either are exactly the same as senior or junior debt, except that they are paid in between the two.
The additional carveout is almost always entirely just to provide the payment priority protection, and thus a higher interest rate than senior debt, but a lowest interest rate than junior debt.
Junior debt
When there are 2 (or more) classes of debt investors, the lowest tier is called junior debt.
Junior debt typically are more risky, as they are paid only after senior/mezzanine debts are paid. Also, junior debt typically don’t have collateral.
In exchange for the increased risk, junior debt tends to command the highest interest rates of all debt tiers.
Preferred equity
Preferred equity can really be anything at all — anything that you can describe in a legal contract (the partnership agreement) is probably fair game.
In some cases, preferred equity share the same uncertain returns as equity, but are paid first in cases of bankruptcies (i.e.: their entire investment is returned to them, and whatever is left is distributed to the equity tier).
Most commonly, however, preferred equity are very similar to debt — they get a fixed coupon that is generally at a higher rate than junior debt, and they may get a little bit extra if the business does exceptionally well.
In exchange for this higher rate of interest, preferred equity gives up the right to call an event of default on the company if their coupons are not made on time.
Equity
The equity tier is typically the lowest priority in terms of distribution of profits. This means that if there isn’t enough money to satisfy the claims of all higher priority tiers, the equity tier may not get any profits at all. However, if the business does exceptionally well, then the equity tier may get a return much higher than all other tiers combined.
The equity tier is also commonly known as “share holders” (or “stock holders”). When you buy and sell a stock, say GOOG, on the public markets, you are essentially trading ownership interests of the equity tier of that company.
A table where a company lists all its debt and equity investors, according to their priority in terms of payment and their contributions to the venture, is called a “capitalization table” (or “cap table” for short). A table or description detailing how the profits are actually distributed (assuming there are any profits to distribute) is called the “waterfall”.
In general, as you go down a cap table, risk increases, but potential return also increases.
To each their own
Which tier you want to invest in, is entirely up to you and your personal situation.
If you are a retiree, and you need stability of income, you may opt to give up some upside, but get more protection by going up the capital stack (i.e.: going up the rows in the cap table).
But if you are investing for the long term, and you are diversified such that your investment in a single company is a relatively small part of your entire portfolio, then it may make sense to take on the additional risks involved in the lower tiers, for a chance at a higher return — even if this particular company goes bankrupt and you lose all your money in it, hopefully, enough other companies that you’ve also invested in will succeed, such that you still make a greater return than investing at a higher tier.
In the end, where each investor ends up on the capital stack depends on their expectations of how the company will perform, as well as their personal financial situation (generally, their ability to withstand uncertain cash flow and/or losses).
Footnotes
“Can”, not “will”, because in most cases, distributions (or dividends) are not paid on new companies. New companies tend to be very cash hungry, as they need cash to spin up their factories, advertising, research, etc., and more cash is almost always better. As such, equity partners generally don’t tend to see a single cent of profits until years 2-3 or beyond. The exact timeline depends on the nature of the business — some cash intensive businesses may not see a dividend for decades!
Technically, a “partnership agreement” is only used in a partnership (this is a legal term). LLC’s (limited liability company) and corporations use “operating agreements” instead. However, for purely financing purposes, the basic principles remain the same — a group of people got together to fund the equity tier of a company, and there’s a document that describes what they can expect to get out of that venture. I’ll use partnerships for simplicity going forward. Understand that the issues discussed affects LLC’s and corporations as well, though perhaps with minor differences.
As with “partnership agreement”, “general partner” and “limited partner” are terms used in partnerships (the legal entity). LLC’s and corporations have different names for these roles (board of directors, executive team vs shareholders, etc.). Despite the naming differences, the roles are mostly the same and for simplicity, I’ll stick with the nomenclature for partnerships.
Real estate vs stocks, the perennial debate. Which one should you invest in?
As usual, a reminder that I am not a financial professional by training — I am a software engineer by training, and by trade. The following is based on my personal understanding, which is gained through self-study and working in finance for a few years.
If you find anything that you feel is incorrect, please feel free to leave a comment, and discuss your thoughts.
Caveats
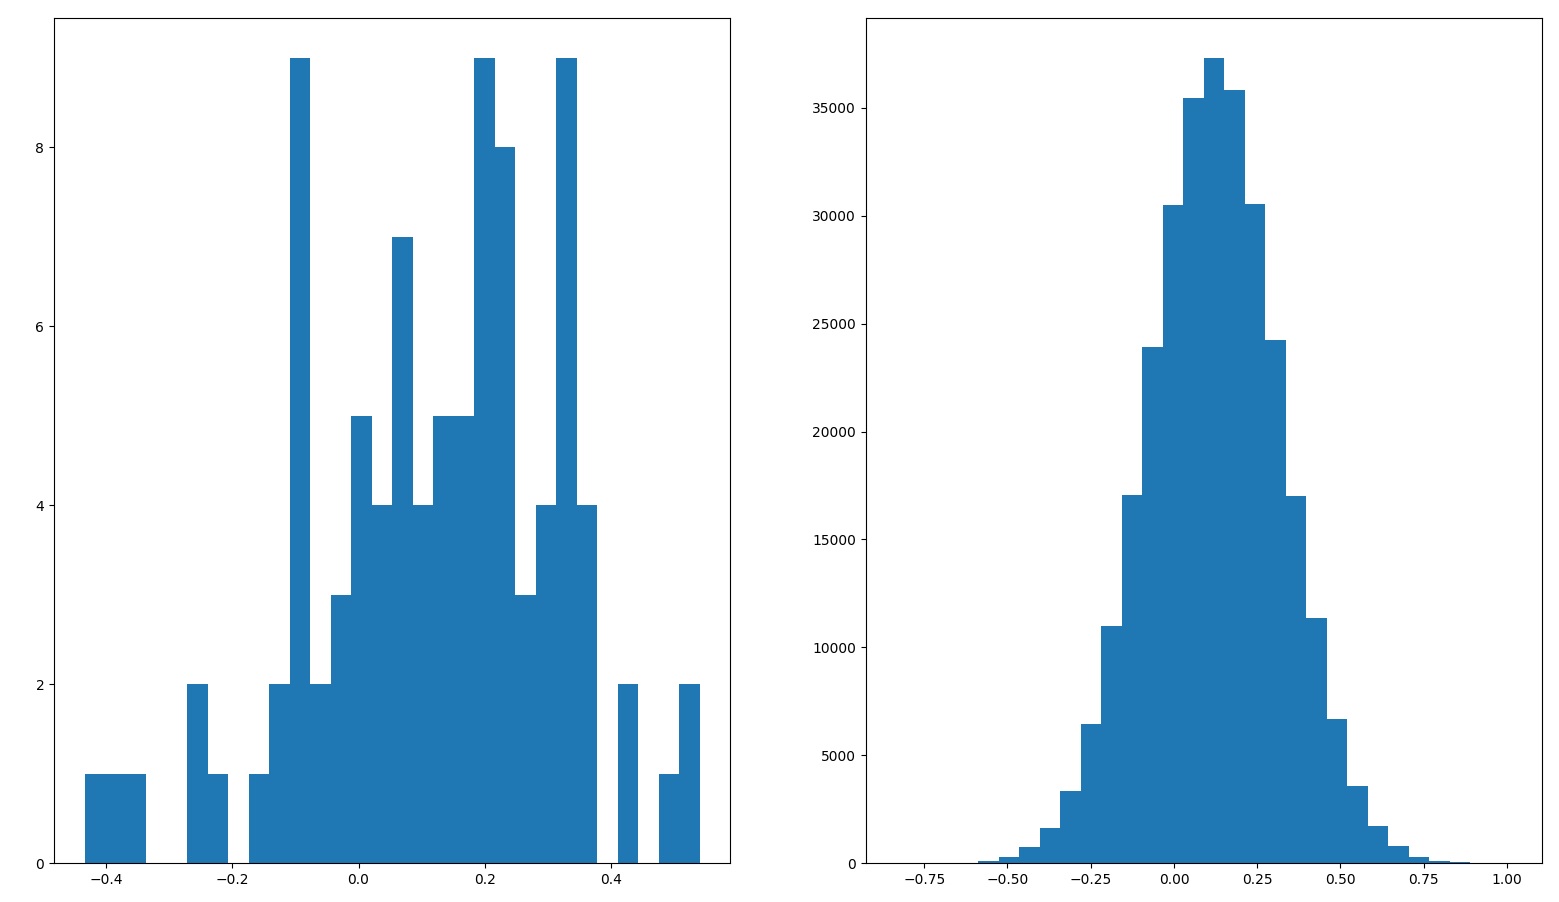
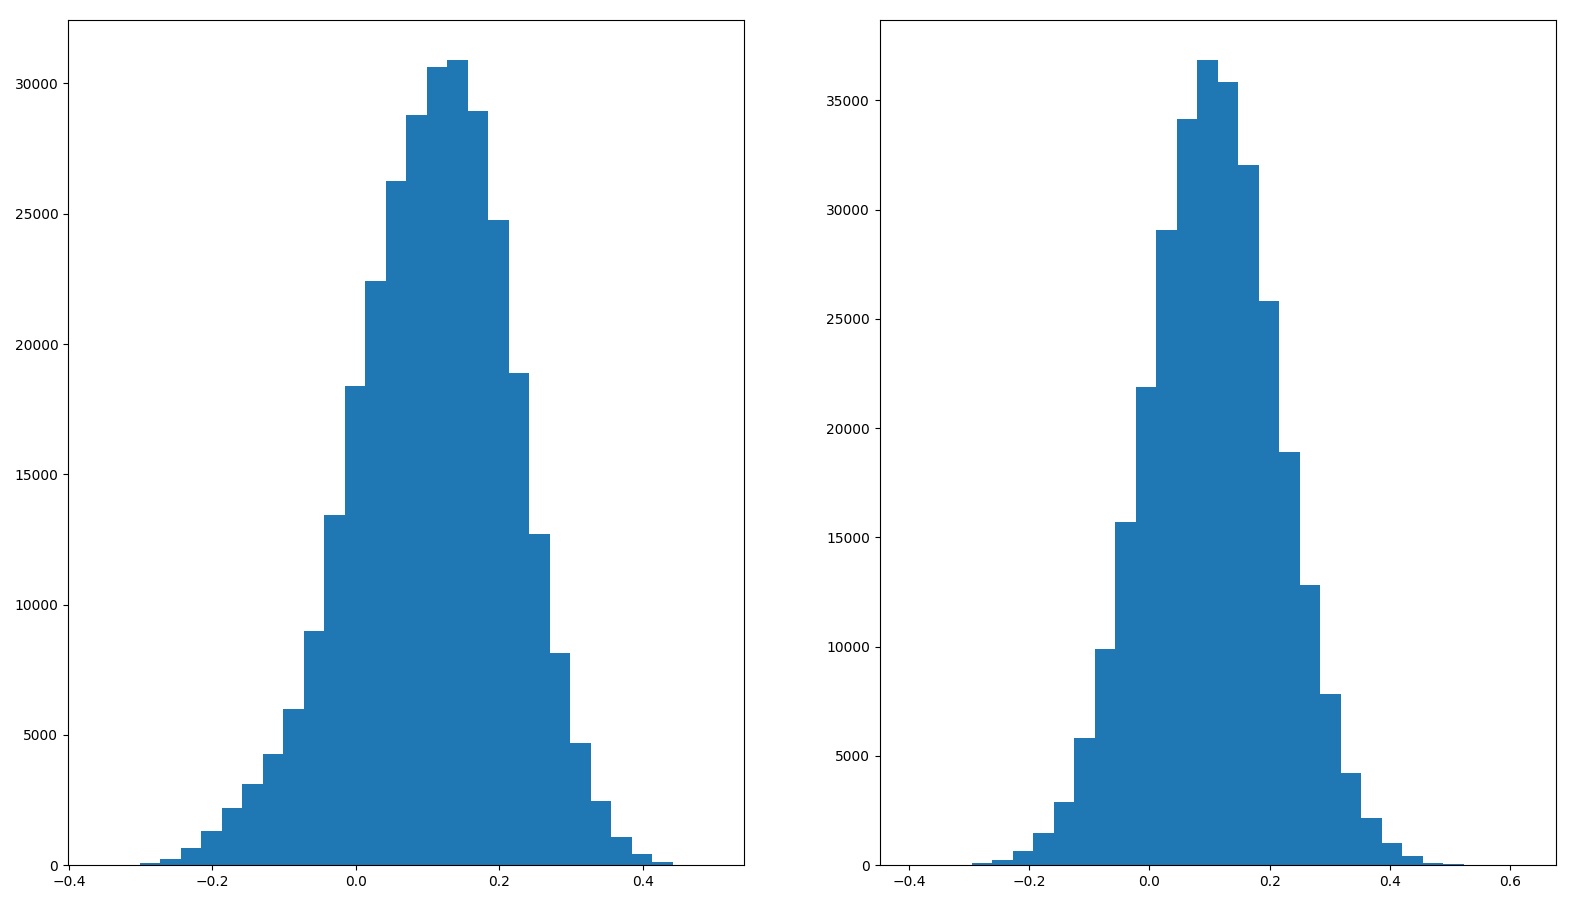
Before we go deeper into the discussion, I’d like to address some criticisms of “Monte Carlo“. To be absolutely clear, in “Monte Carlo” and in this post, I use simplified models to represent returns from various assets. In particular, stock returns have been modeled as normal distributions, which isn’t quite correct:
Left: Historical total returns of S&P500 from 1926 to 2020, inclusive. Right: Normal distribution with 12.2% mean returns and 19.7% standard deviation.
As you can see from the histograms, actual stock markets total returns (left) is quite different from the stylized normal distribution with similar mean and standard deviation.
Separately, assumptions that stocks and bonds (and in this post, real estate) returns are completely uncorrelated are clearly too permissive. In reality, stocks, bonds and real estate are somewhat (negatively) correlated over short periods of time, as all of them are generally affected by politics, inflation and interest rates, amongst other things.
That said, the point of “Monte Carlo” and this post isn’t to build a perfect model for anyone’s financial planning purposes. Instead, these 2 posts are meant to explore various aspects of portfolio construction — how you should think about expected returns, CAGR, SWR, and how volatility affects these metrics. With this rather more modest goal, I believe the simplified models used are more than adequate.
My my, what low returns you have!
In “My Personal Portfolio“, I mentioned that I invest heavily in real estate, generally via private real estate syndications.
In some private discussions about real estate syndications, others have noted that the pro forma returns presented by some real estate syndications that I invest with (generally in the 10-15% range) are lower than what the stock markets have returned in the past 20 years or so.
If you pick up a calculator, you’ll find that from 2009 – 2020 stocks have returned about 15.5% on average every year, with a CAGR of about 15%. Compared to the 10-15% pro forma returns, it seems silly to even consider real estate.
Therefore, we should just invest 100% in stocks… right?
Expected returns
The first problem with the 100% stocks assertion, is that expected returns are misleading — expected returns are merely “expected” as opposed to “realized”. The future is always uncertain, and it is entirely possible that the next N years see returns dramatically below expected returns based on the past N years.
That is why in “Monte Carlo“, each test is done 10,000 times and the metrics reported are the averages of the 10,000 simulations. However, since the average person cannot live 10,000 lives and pick the best/median/average lives (1), these numbers should be taken with a pinch of salt — they are expected values, not realized nor even predicted values. In the context of a single lifetime, the law of large numbers simply does not hold.
Looking further
The next problem with the 100% stocks assertion is that only looking at the expected returns of the past ~11 years is misleading. Typically, expected returns are the arithmetic means of historical returns. In effect, they tell you “given a random year, what is the expected returns of that year”. Stock markets, however, do not always go up uninterrupted — periods of growth are punctuated with periods of declines.
In the context of historical stock markets performance, the past ~11 years have been unusually kind to stock investors, and it is currently not clear if future years will be as kind.
Since returns are multiplicative, a few years of subpar returns in the future will reduce lifetime CAGR significantly. In “Monte Carlo“, I presented historical total returns of the S&P 500, which suggests that long term CAGR is closer to 10%, with mean annual total returns of around 12.2%. Suddenly real estate is looking much better(2)!
Volatility
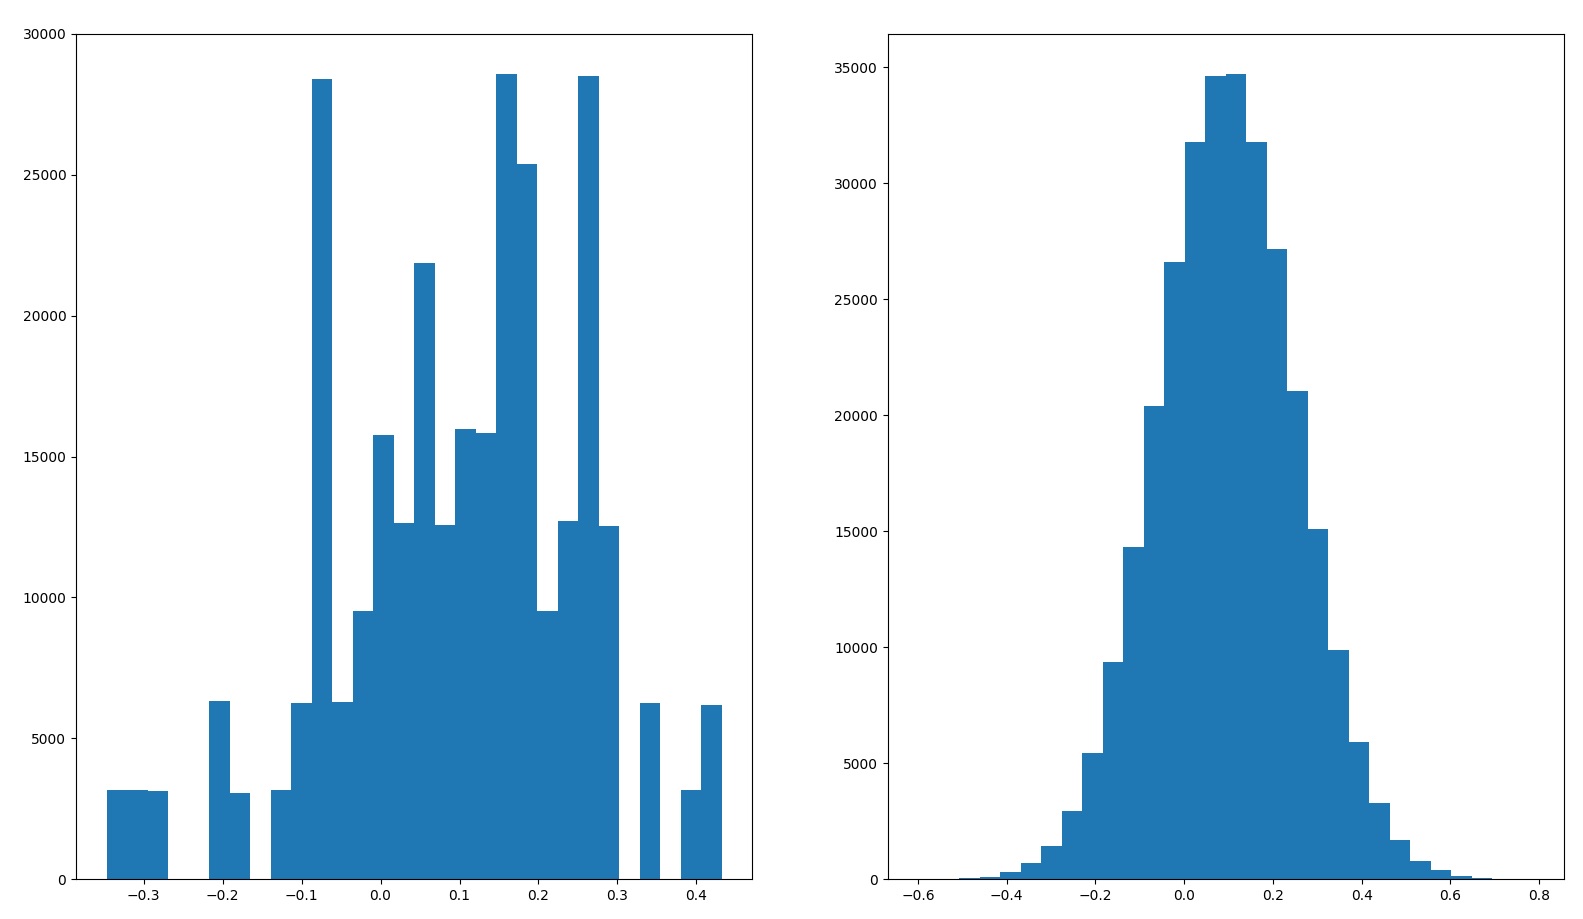
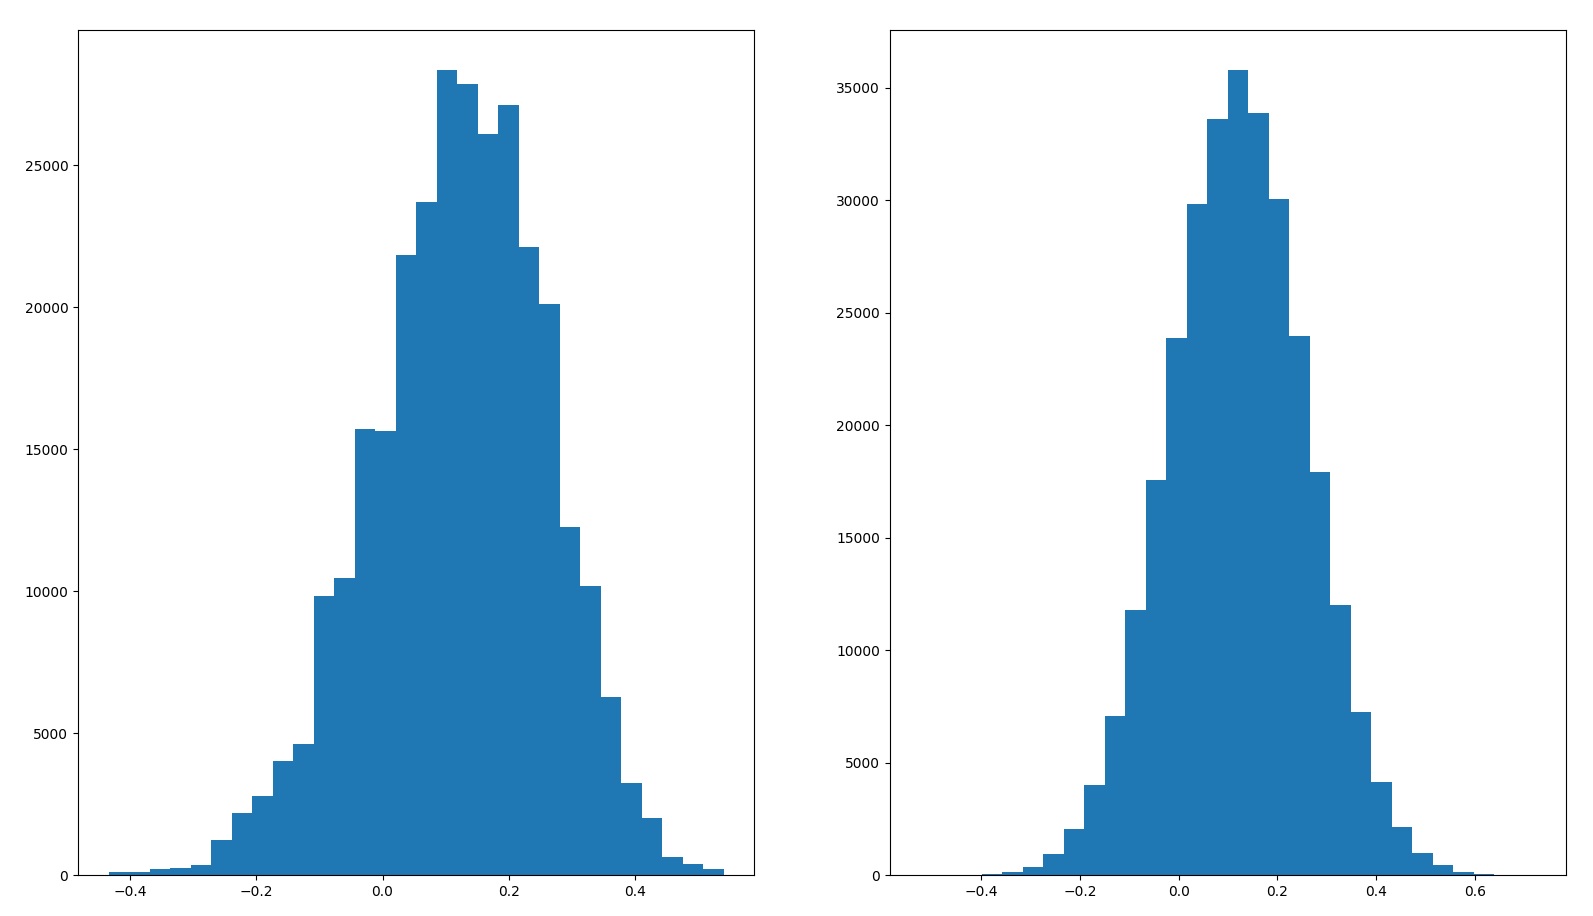
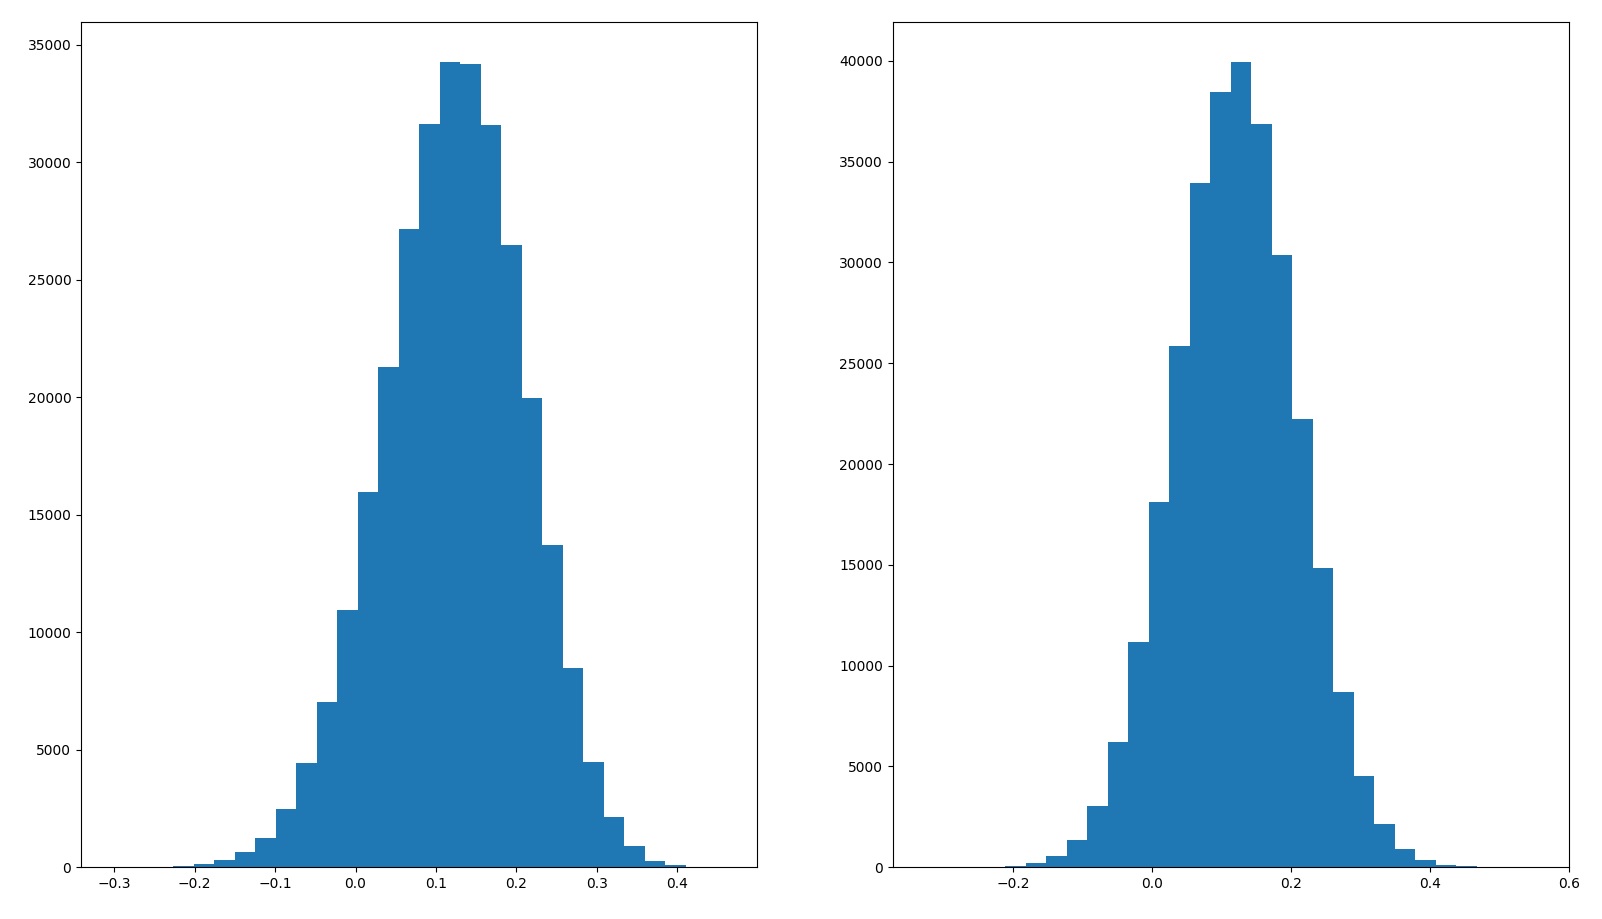
As we’ve discussed above and in “Monte Carlo“, volatility in the portfolio, as represented by standard deviation of annual total returns, can dramatically curtail the safe withdrawal rate from that portfolio. To illustrate this point, let’s look at some example scenarios.
In each of these, stocks are represented by both their sampled historical returns as well as their normally distributed returns (mean 12.1%, standard deviation 19.7%). The 2 alternate universes is a hypothetical scenario, where we invest 50% of our portfolio each in 2 completely independent stock markets (i.e.: each stock market in its own alternate universe). 5 alternate universes is where we invest 20% of our portfolio each in 5 completely independent stock markets. Real estate is represented by a normally distributed model with mean of 9% and standard deviation of 10% (3).
In each case, the portfolio is rebalanced annually so that the portfolio is distributed across the assets according to the description.
The histogram on the left is when we use sampled historical stock returns for the simulation, and the histogram on the right is when we use normalized stock returns.
Portfolio
Average returns
Standard deviation of returns
Histogram of returns
100% stocks
Sampled – 12.1% Normalized – 12.1%
Sampled – 19.7% Normalized – 19.7%
80% stocks 20% cash
Sampled – 9.7% Normalized – 9.7%
Sampled – 15.6% Normalized – 15.7%
2 alternate universes
Sampled – 12.2% Normalized – 12.2%
Sampled – 13.8% Normalized – 13.9%
5 alternate universes
Sampled – 12.1% Normalized – 12.2%
Sampled – 8.75% Normalized – 8.79%
50% stocks 50% real estate
Sampled – 10.6% Normalized – 10.6%
Sampled – 11.00% Normalized – 11.00%
And for the same 5 portfolios, we compute the CAGR and SWR over 30 years (see “Monte Carlo” for a full description of the methodology details).
Portfolio
Average return
Median return
CAGR
SWR 90%
SWR 95%
SWR 99%
100% stocks
Sampled – 12.1% Normalized – 12.1%
Sampled – 13.9% Normalized – 12.1%
Sampled – 10.3% Normalized – 10.4%
Sampled – 3.78% Normalized – 3.95%
Sampled – 3.00% Normalized – 3.25%
Sampled – 1.87% Normalized – 2.08%
80% stocks 20% cash
Sampled – 9.7% Normalized – 9.7%
Sampled – 11.1% Normalized – 9.8%
Sampled – 8.5% Normalized – 8.6%
Sampled – 3.65% Normalized – 3.78%
Sampled – 3.05% Normalized – 3.22%
Sampled – 2.11% Normalized – 2.32%
2 alternate universes
Sampled – 12.2% Normalized – 12.2%
Sampled – 12.9% Normalized – 12.2%
Sampled – 11.3% Normalized – 11.3%
Sampled – 5.42% Normalized – 5.46%
Sampled – 4.76% Normalized – 4.82%
Sampled – 3.60% Normalized – 3.74%
5 alternate universes
Sampled – 12.1% Normalized – 12.2%
Sampled – 12.4% Normalized – 12.1%
Sampled – 11.8% Normalized – 11.8%
Sampled – 6.74% Normalized – 6.78%
Sampled – 6.26% Normalized – 6.34%
Sampled – 5.39% Normalized – 5.46%
50% stocks 50% real estate
Sampled – 10.6% Normalized – 10.6%
Sampled – 11.2% Normalized – 10.6%
Sampled – 10.1% Normalized – 10.0%
Sampled – 5.27% Normalized – 5.29%
Sampled – 4.70% Normalized – 4.81%
Sampled – 3.80% Normalized – 3.93%
Some interesting results:
If we invest in 2 or more independent assets, then the sampled returns approximate the normally distributed model.
This is why the differences between using sampled stock returns and normally distributed model is generally small, especially when we consider a diversified portfolio.
If you just put 20% of your assets in cash, and 80% in stocks, your expected returns will suffer. However, somewhere in the 95-99%-ile range, your SWR will actually go up.
If you can invest in stock markets in 2 alternate universes, then your expected annual returns will remain roughly the same. But your CAGR and SWR will increase dramatically.
This is even more pronounced if you can invest in 5 alternate universes.
Since I am a mere mortal, the best I can do is invest 50% in stocks and 50% in real estate, which definitely helps SWR, and maybe helps with CAGR as well(3).
Diversification
The basic idea behind the magical increase in CAGR and SWR beyond 100% stocks, is simply “diversification”. When you diversify, and you rebalance your portfolio periodically (4), what you are doing is essentially selling high (the asset which outperformed) and buying low (the asset which underperformed). Buying low and selling high is, historically, the winning strategy for investing (and speculating), and will likely remaining a winning strategy in the future (5).
So, the last problem with the 100% stocks strategy, is that even if real estate has a lower expected annual returns and lower expected CAGR than stocks (3), the very fact that they are not very correlated to stocks means that an allocation to real estate can help increase your portfolio’s CAGR and SWR.
This is the same principle in use when financial advisors recommend investing in index funds (as opposed to single name stocks) — diversification helps to reduce overall volatility and regular rebalancing forces you to buy low and sell high.
Side note: taking profits
A corollary that is not immediately obvious from the above, is the act of “taking profits”. Historically, when people have asked me for advice on what to do after some speculative asset they’ve bought appreciated by a huge amount (more than 100% increase in price), my general advice is something along the lines of “sell enough so that you take a decent profit, and won’t be sad if everything else drops back to your cost basis.”
The psychological effect of doing so is that you’ve now already realized a decent profit, and everything left in that asset is essentially “house money”. While a mathematical fallacy, I have found that this has made holding on to a speculative asset that much easier.
The financial/mathematical effect of doing so, is essentially the same as diversification. Assuming the money you take out is put into another (not very correlated) asset, then you have essentially achieved the “2 alternate universes” scenario.
Code
What kind of a nerd would I be, if I didn’t also present the code for the simulations mentioned above? Note that this builds upon the code in “Monte Carlo” — you’ll need to copy the code there and save it in a file titled “montecarlo.py” for the code below to work.
This is an imperfect comparison. The pro forma returns from syndications are estimates and may be wrong (though in my, very limited, experience good sponsors tend to underestimate returns). Also, the pro forma returns of syndications today have very little bearings on historical total returns of real estate over long periods of time. Certainly, the Great Financial Crisis of 2008 taught us that real estate prices can go down too!
Real estate returns are hard to measure, because real estate tends to illiquid and non-fungible, and the way depreciation affects accounting just confounds that matter even more. The 9% mean, 10% standard deviation modeled here is mostly out of thin air — I picked 9%/10% because it is a lower return with lower volatility than stocks. Some (unverified) data I’ve found suggests this is too pessimistic — historical real estate returns seems to be better than this.
Rebalancing periodically is key here! If you do not rebalance, then most, if not all, the benefits of diversification goes away. Every time I hear someone boast about how they are both “diversified” and “passive” (so passive that they do not rebalance), I die a little bit inside. I am already old, stop trying to help me along.
If you’ve managed to lose money by buying low and selling high, please let me know!