This is a quick note, which tends to be just off the cuff thoughts/ideas that look at current market situations, and to try to encourage some discussions.
CPI came in hotter than expected, the exact opposite of what I’ve expected yesterday, yet stocks are up, and my QQQ call spreads made money. Wut?
As usual, a reminder that I am not a financial professional by training — I am a software engineer by training, and by trade. The following is based on my personal understanding, which is gained through self-study and working in finance for a few years.
If you find anything that you feel is incorrect, please feel free to leave a comment, and discuss your thoughts.
Rabbit’s foot
As I’ve noted yesterday, I had expected CPI to come in cooler than expected, thus causing markets to rise. Instead, CPI came in slightly hotter than expected, but after a small dip in the morning, markets are now up.
So while my premise was entirely wrong, my QQQ call spreads are up and I’ve taken the profits.
PPI and FOMC decisions are coming tomorrow. Given the unstoppable nature of the market, I’m inclined to just shrug my shoulders and go along with the flow.
If the market wishes to go up despite stronger NFP (last Friday) and stronger CPI, then it seems like there’s a decent chance it’ll find a reason to go up anyway tomorrow.
Sometimes you just have to laugh — If the world wants to throw money at you, the least you can do is to open your pockets.
StockClubs
If you want to follow along and see what other stupid things I do, feel free to follow me on StockClubs — note that this is only one of 10+ of my brokerage accounts, and I’m an investor in StockClubs.
This is a quick note, which tends to be just off the cuff thoughts/ideas that look at current market situations, and to try to encourage some discussions.
In just a few more hours, we’ll get the latest and final CPI print for 2023, followed 24 hours later by the final PPI print, and on the same day of the PPI print, FOMC rate decisions plus Powell press conference. The next ~40 hours is going to be very interesting indeed.
As usual, a reminder that I am not a financial professional by training — I am a software engineer by training, and by trade. The following is based on my personal understanding, which is gained through self-study and working in finance for a few years.
If you find anything that you feel is incorrect, please feel free to leave a comment, and discuss your thoughts.
I made a bunch more bets on various earning reports, and ended up with a slightly larger gain. As of now, the only short-term bets I have on are:
Long CAVA bearish put spreads till 12/29
Long TLT bullish call spreads till 12/29
Long QQQ bullish call spreads till 12/12
CAVA
CAVA IPO’d on June 15th, 2023 with about 14m shares sold to the public — the rest of its shares are prevented from selling for 180 days due to the standard lock-up for insiders in IPOs.
That 180 days of lock up ends on December 12th, 2023 (tomorrow).
According to Yahoo Finance, CAVA has about 113m shares outstanding. 14m of those were initially sold during the IPO, leaving about 99m. Of the 99m, some were probably warrants/stock options that were exercised, though the exact number is unclear.
But no matter how you slice it, a large number of new shares will become eligible for sales tomorrow, possibly up to ~7x the number of shares in the initial sales, representing ~66x the average daily volume.
Even if a small fraction of those insiders decide to sell, there will likely be a lot of selling pressure on CAVA, hence the bearish positioning.
TLT
This is the remnants of my long TLT play from when I first flipped bullish. It is currently up a substantial amount, but I think it can possibly go up a little bit more before I close this remaining portion of the play (see below).
QQQ
And the final piece — today I entered into a levered long position on QQQ, because CPI is coming out tomorrow (December 12th) at 8.30am.
Looking at the last CPI breakdown, a large part of the inflation in the measure is from housing. However, talking/listening to the fund managers of my private equity real estate investments, the common thread is that rent across most of the USA is stalling or coming down. This trend of flat/lowering rents started becoming pronounced around August/September, and did not appear to abate in November.
Therefore, I’m expecting CPI numbers to come in weak tomorrow, same as inflation numbers from Europe has been relatively weak recently.
This should, hopefully, result in a short term sentiment boost to stocks as traders bet on Fed easing, or at least an end to rate hikes.
Everyone is out to find the next long term compounder — a company with such a strong business model that its earnings compounds steadily over the years. The thinking is that for such a company, if you have a long time horizon, then the price mostly doesn’t matter — simply buy and hold, and eventually, the compounding will make it all worthwhile.
Or will it?
As usual, a reminder that I am not a financial professional by training — I am a software engineer by training, and by trade. The following is based on my personal understanding, which is gained through self-study and working in finance for a few years.
If you find anything that you feel is incorrect, please feel free to leave a comment, and discuss your thoughts.
Consistent, long term compounder
Consider the revenue graph of company X, which compounds from $20.22B in 2000 to $58.03B in 2022, a CAGR of about 4.9%:
And its earnings graph, which compounds from -$1.39B in 2000, to $3.74B in 2001, to $16.72B in 2022, a CAGR of about 7% (from 2001 to 2022):
It should be clear, visually, that this company is doing pretty well — even in the depths of the Great Financial Crisis, it was holding up pretty well, and since it first became profitable in 2001, company X has never even flirted with the 0 earnings line at any point in time.
So, if I told you that company X has an all time market cap high of $Y, where do you think its market cap is today?
$Y
Within 5% of $Y
Within 10% of $Y
This is the market cap chart of company X, also known as Cisco (CSCO) from the same source of the graphs above (Companies MarketCap):
23 years after annualized growth of ~5% revenue and ~7% earnings, the company’s market cap is DOWN about 30%. (edit: I was informed that this is misleading — CSCO pays a dividend and has had for years, so if you include the dividends, the performance is much better. That said, the return will still be subpar due to the high entry price.)
How’s that for a consistent, long term compounder?
Relevance
As we come out of what appears to be (at least, temporarily) a downturn in the markets (in 2022), a point to remember, is that by most historical metrics (1), the markets are pretty expensive today. They were, of course, much more insanely expensive in 2021, when the markets had truly gone wild, but Q4 2021 and 2022 brought us back down to Earth just a little bit.
However, even as most of the market, minus the Magnificent 7, appears to be close to fairly priced (again, by historical metrics (1)), it is important to remember that there are still pockets of excessive exuberance, of stocks priced to such ridiculous extremes that the probability of them returning a generous rate of investment returns (2) over the long term seems rather unlikely.
To be clear, while it is possible to make a handsome profit if you are speculating (2) in these stocks in the short term, investment returns (2) requires holding that position for the long term and profiting only off its productive output, i.e. not selling to a greater fool.
And this is where some folks will start pointing fingers and start screaming “perma bear”. The truth is, if you follow me on StockClubs (3), you’ll realize that my portfolio is actually pretty long the market (levered long right now actually), and other than a brief period from early August to early November, it has generally been long.
There is, always, some assets that are overvalued, and some assets that are undervalued. Yes, sometimes, the only undervalued asset is “cash”, but that’s relatively rare.
Rational, long term portfolio management isn’t about putting money on things you like, or things that others like, or even things that are doing well now — it is to weigh the pros and cons of every position, figure out what is likely undervalued, and then overweight your portfolio towards those assets.
Certainly, overvalued assets can become more overvalued — that is how we get bubbles, after all. And certainly, undervalued assets can become more undervalued, which is how we get depressions.
But it is my opinion that if you consistently weigh your portfolio towards (4) what is undervalued, and underweight what is overvalued, then over the long term, reversion to the mean of ridiculously high (or low) valuations will generally work out in your favor.
Footnotes
A constant consternation by some is my reference to “historical metrics”. By this, I mean things like trailing P/E, P/S ratios, etc. For an example of what the the S&P500 looks like today relative to its past in terms of P/E ratio, please see https://www.multpl.com/s-p-500-pe-ratio.
Disclaimer: I am an investor in StockClubs, and I’m only sharing one (out of 10+) of my brokerage accounts on the app.
To be clear, “weigh your portfolio towards” does NOT mean sell everything else and only buy something or other. It simply means giving something more weight in the portfolio.
This is a quick note, which tends to be just off the cuff thoughts/ideas that look at current market situations, and to try to encourage some discussions.
An update to the Santa Rally, 2023.
As usual, a reminder that I am not a financial professional by training — I am a software engineer by training, and by trade. The following is based on my personal understanding, which is gained through self-study and working in finance for a few years.
If you find anything that you feel is incorrect, please feel free to leave a comment, and discuss your thoughts.
Yesterday, November 15th, 2023, I’ve taken off basically all my call spreads which were betting on the Santa Rally.
Yes, I understand Christmas isn’t for another month and change.
The reason for this is 2 fold:
On Tuesday (11/14), markets and bonds ramped dramatically after a CPI print that is only slightly below expectations.
After the ramp, the market was generally moribund and directionless, though trading feels a little heavy.
This is just a feeling, and well, trading is all about sentiments — it feels like the move on Tuesday was a massive short squeeze. Further, it feels like most of the shorts are now out of their positions.
Which suggests that at least in the short term, markets may trade weak/sideways. Since a call spread decays theta over time, it seems like a good idea to close out the spreads and take my profits.
Maybe if the market perks up again I’ll reenter the Santa trade. But for now, I’m taking a breather.
This is a quick note, which tends to be just off the cuff thoughts/ideas that look at current market situations, and to try to encourage some discussions.
The end of the year is upon us, and as with most years, it appears that the Santa Rally is upon us.
As usual, a reminder that I am not a financial professional by training — I am a software engineer by training, and by trade. The following is based on my personal understanding, which is gained through self-study and working in finance for a few years.
If you find anything that you feel is incorrect, please feel free to leave a comment, and discuss your thoughts.
Update
Continuing with our short term trading updates:
If you follow me on StockClubs (1), you may notice that after the Treasury’s Quarterly Refunding Announcement (QRA), followed by the rather dovish FOMC meeting, I’ve closed my market shorts. Across all my accounts with a similar short, the losses and gains net out to a small gain.
At the same time, I had on a bunch of quarterly earnings reports plays, mostly doing with shorting tech names. While the majority of calls were wrong (TSLA – went down after earnings [right], NFLX – went up , GOOG – went down, MSFT – went up, SNAP – went up, META – went down, AMZN – went up, INTC- went up), the play was that given how markets were punishing weak and even decent earnings while not really rewarding beats, the overall risk/reward for shorting into earnings seemed good.
And I would have made a small profit too… if I hadn’t been too greedy. On the day of META’s earnings, the market went down just after I opened the short, giving me a small gain even before the earnings report. If I had left the trade on, or taken profit, I’d have a net gain (across all the trades). Instead, I closed the position, and reopened a put spread further out, while opening a call spread — the bet was that given the already downbeat market, META will likely move regardless of earnings, though it now had a higher chance of going up.
Well, META moved down the next day, and I was sitting on pretty decent gains on the new put spread — more than enough to cover the costs of the call spread… except that I got greedy and I decided to let it sit to capture more profits. Of course, that evening AMZN reported stellar earnings, so good in fact, that it caused the entire tech sector to rally, and my META short gains to vaporize.
So now my earnings report play is sitting on a bunch of losses, large enough that across both market and earnings plays, I’m down slightly. Bummer.
Santa Rally
Prior to the Treasury QRA, I was thinking that there’s a 50/50 chance of a Santa Rally this year — there are a lot of risks in the world:
Potential of middle east regional war leading to oil price spike
American consumer looks increasingly tapped out
China financial weakness
Potential Japanese tightening due to inflation
Potential US government shutdown in mid November
Credit losses on commercial real estate properties
Housing market turning weaker
Earnings from companies seemed weak
But there are also a lot of potential catalysts for a rally:
Israel seems to be moderating their stance somewhat after international pressure
American consumer is still much stronger than expected
China seems to be starting to ease
Ueda seems to be going about Japanese tightening very timidly
Losses on commercial real estate seems confined to commercial real estate, mostly office spaces
Housing market weakness seems mostly limited to certain regions
Earnings season is mostly done, at least for the big names.
So I was on the fence about holding my shorts, closing them or even opening longs.
But the Treasury QRA and the following Fed FOMC press conference suggested two things:
Both the Treasury and the Fed seemed keen to avoid pushing the market too hard, and seemed in fact to be trying to limit longer duration Treasury bond weakness
Given that both monetary and fiscal policies appear to be trying to keep markets happy, as long as nothing dramatic happens, it feels like on the net, betting on a Santa Rally seems like a better risk/reward play till the end of the year.
In that spirit, I’ve closed all my market shorts across all accounts. There are also no earnings report that I am really excited to play for the rest of this earnings season. Instead, I’ve opened a few bullish positions across my accounts:
Call spreads on TLT
Call spreads on QQQ
Call spreads on VOO
The reason why I’m switching from betting on SPY is because of wash sales rules — I avoid trading the same names across the December/January divide, as that makes taxes regarding wash sales easier to deal with (you don’t have to carry losses into the new year). By only trading QQQ now, I can just avoid QQQ in January and only trade SPY then.
Hope and a prayer
Readers should be reminded that my previous short plays did not quite pan out as expected, so there’s a very good chance that this new long play will be rewarded with a lump of coal.
I guess we’ll see….
Footnotes
Disclaimer: I am an investor in StockClubs, and only one (out of 10+) of my brokerage accounts are shown there.
This is a quick note, which tends to be just off the cuff thoughts/ideas that look at current market situations, and to try to encourage some discussions.
It’s earnings season again, and if you’ve read Making moves, you should know that I’m short the market since around early August. What’s next?
As usual, a reminder that I am not a financial professional by training — I am a software engineer by training, and by trade. The following is based on my personal understanding, which is gained through self-study and working in finance for a few years.
If you find anything that you feel is incorrect, please feel free to leave a comment, and discuss your thoughts.
Update
First off, a bit of an update on the August short:
I shorted the market with a small portion of my portfolio using highly levered puts. Because much of my portfolio is flat, and because the puts were quite a bit out of the money, I ended up being net short the market slightly, with a positive gamma (i.e. the more the market falls, the more short the market I become).
If you follow me on StockClubs (1), you’ll notice that the put spread I bought expires in mid November. I have similar trades (shorting SPY, VOO, or long VIX) in other accounts, some of which have different expiry dates.
The market has since fallen quite a bit, and so far, I am up on this position — roughly 50% across all accounts.
Earnings
As earnings season rolled around, some folks on StockClubs noticed that I have opened shorts on various names (so far TSLA, NFLX, GOOG, MSFT, SNAP), and asked about those positions.
In each of these cases, the position is a short bet using put spreads that expire soon (the very next expiry in all cases), targeting a max gain of 2-3x when the stock drops around 3-5% post earnings.
The rationale for these bets is simple — if you’ve been following the earnings season so far, companies that report poor results, and even some companies that have reported decent results, have been punished severely, while companies that reported good results have generally been muted.
For example, yesterday GOOG reported overall decent results, though one segment (cloud) did poorly, and their stock was punished by a 9% drop today. MSFT, on the other hand, reported pretty good results, and their stock is only up around 4%.
I am trying to play this apparent downward bias after earnings report.
So far, I’ve been correct on TSLA and GOOG, and wrong on the rest (NFLX, MSFT, SNAP). But because the gains are so biased towards the downside (2-3x gains for a relatively small drop), I’m actually ahead quite a bit after tallying up all wins and losses.
On top of this bias towards the downside, most of the factors mentioned in Making moves still apply, which further helps with the probability of downside profits.
Discussion
For those who aren’t aware, StockClubs now feature comments on trades and discussion posts to encourage more community engagement. If you have questions about my trades, feel free to ask in the app. See you there!
Footnotes
Disclaimer: I am an investor in StockClubs, and only one (out of 10+) of my brokerage accounts are shown there.
This is a quick note, which tends to be just off the cuff thoughts/ideas that look at current market situations, and to try to encourage some discussions.
If you’ve been reading my writing for a while, you’ll probably know that I am a big fan of Patrick Boyle, a hedge fund manager, college finance professor and youtuber. This week, he interviews Zeke Faux, a reporter who investigated and wrote a social historical book on the crypto scene of the past ~3 years.
As usual, a reminder that I am not a financial professional by training — I am a software engineer by training, and by trade. The following is based on my personal understanding, which is gained through self-study and working in finance for a few years.
If you find anything that you feel is incorrect, please feel free to leave a comment, and discuss your thoughts.
How should we evaluate a $100 company that pays $10 in dividends a year, every year, vs another $100 company that pays $5 in dividends this year, $5.25 next year, $5.51 the year after, and so on, increasing its dividends by 5% a year?
As usual, a reminder that I am not a financial professional by training — I am a software engineer by training, and by trade. The following is based on my personal understanding, which is gained through self-study and working in finance for a few years.
If you find anything that you feel is incorrect, please feel free to leave a comment, and discuss your thoughts.
Perfect world
Let’s say we have a business that scales infinitely at 10% returns — for every $100 you invest in it, it will return $10 every year in perpetuity. Further, let’s say we live in a perfect world, where there are no taxes to worry about and other transactional costs.
This business is, then, the first example from above — the $100 company that pays $10 in dividends every year.
Transmogrify
Now, imagine if at the end of year 1, instead of pocketing the $10 in dividends, you pocket $5, and invest $5 into the company. Now you have $105 invested in the company, so your next dividend will be $10.5. Again, you do the same thing, pocket half, and put the rest back into the company — in year 2, you’ll then pocket $5.25, and reinvest $5.25 for a total of $110.25 invested. In year 3, you’ll get $11.02 in dividends, of which you’ll pocket $5.51, and reinvest $5.51, and so on.
If you look at the numbers closely, you’ll realize that we’ve transformed our 10% dividend paying company, into a 5% dividend paying company, but with a 5% increase in dividends every year.
In general, absent frictional costs (like taxes, transaction costs, etc.), an asset that yields X% a year every year, is equivalent to an asset that yields Y% a year, but which grows the dividends at (X-Y)% a year — The difference (X-Y)% in yearly yield can be considered as being re-invested to grow the next year’s yield at an additional (X-Y)%.
Welcome to Earth
Of course, in real life, there are taxes and there are transactional costs — in the prior example, your $10 per year in dividends will be taxed, leaving you less than the desired amount to reinvest so that you cannot achieve the 5% increase in dividends for the next year — one way of thinking of it, is if the money was directly reinvested instead of first being passed to you as dividends, the taxes on that reinvested part will not be due yet, and so will compound for you instead of the government.
But even though so, in many cases, it is useful as a rule of thumb to think of the two companies as essentially equivalent. There are many ways around the frictional costs conundrum:
You could invest using a tax-advantaged account such as an IRA or a 401(k), in which case, there are no tax consequences right now either way.
If you didn’t intend to reinvest anyway, the tax drag is irrelevant.
When you pay taxes, and then reinvest in a smaller piece of the company with after tax money, your cost basis for that smaller piece of the company is higher, which reduces future taxes.
Reinvesting involves increasing your stake, which involves additional risks. The taxes paid now can be considered a counterbalancing force for not taking on those additional risks.
In practice, since tax rates can differ dramatically between different investors, many financial decisions are evaluated without taking taxes into consideration, with tax considerations being worked in later at the edges. So while a single person investing their own money may prefer one company or the other (depending on their personal tax situation), a fund manager (who services multiple clients with different tax situations) may actually treat the two companies as essentially the same.
Risks
One thing we only briefly touched on, is the idea of risk. If you take the $10 in dividends now, that’s a $10 profit there and then. But if you reinvest $5, then you are betting that the increased 5% of investment will result in 5% (or higher!) increase in yield going forward.
That may not be true!
Unlike our toy example, most businesses in practice do not scale forever. Whether you are selling cars, TVs, or services, at some point, you simply run out of customers to sell to. Also, as companies get bigger and bigger, bureaucratic overheads tend to grow and at some point, the marginal rate of return simply diminishes to 0 or even negative.
Which is to say, cash now is certain, while future growth is uncertain, and most investors will generally demand that an increase in investment of X% results in more than X% increase in yield going forward. Otherwise, it may not make sense from a risk/reward perspective.
We’ve discuss the capital stack of a company before — basically how the company funds its initial creation and ongoing concerns. But why are there so many classes of funding? Why not just fund the entire company with equity? Or with debt?
As usual, a reminder that I am not a financial professional by training — I am a software engineer by training, and by trade. The following is based on my personal understanding, which is gained through self-study and working in finance for a few years.
If you find anything that you feel is incorrect, please feel free to leave a comment, and discuss your thoughts.
Perfect business
Let’s say we have found a magical business — it scales perfectly from $0 to infinity amount of money we invest in the business, and for every $1 invested, it will return 10c every single year. So, if we invest $100 into the business today, it’ll return $10 at the end of 1 year, another $10 at the end of the 2nd year, and so on.
A naïve view would say that this business returns 10%. But can we do better?
Terminologies
Before we go further, let’s get some terminologies out of the way:
Term
Definition
Returns on invested capital (ROIC)
A measure of the efficiency of a business, it is defined by NOPAT divided by invested capital: NOPAT / Invested capital
Cash returns on invested capital (CROIC)
A measure of the efficiency of a business, it is defined by free cash flow divided by invested capital: Free cash flow / Invested capital
Cash returns on capital invested (CROCI)
Not to be confused with CROIC, CROCI is another measure of the efficiency of a business and is more commonly used for enterprise purposes (i.e. when a company is trying to buy another company). It is defined by EBITDA divided by total equity: EBITDA / Equity
Invested capital
The total amount of capital invested into a business, generally defined as total equity + total debt: Equity + Debt
Net operating profit after tax (NOPAT)
A measure of how profitable a business is, it is defined by net operating profit – taxes: Net operating profits – taxes
Net operating profit
A measure of how profitable a business is, it is defined by free cash flow – depreciation – amortization: Free cash flow – depreciation – amortization (1)
Free cash flow
Another measure of how profitable a business is, it is defined by: Total sales – COGS – Operating expenses – Capex
Costs of goods sold (COGS)
The cost of making each unit of product sold by the business
Operating expenses
All costs related to a company’s primary business, other than COGS, such as sales and general administrative costs, etc.
For the purposes of this discussion, we’ll focus on ROIC.
ROIC
In our little toy example, the ROIC of the business is simply 10% — for every $1 invested, we get 10c back per year.
Does this mean that the owner of the company, i.e. the shareholders must settle for a 10% return on their money? Is there anything they can do to improve those returns?
Financial alchemy
Let’s say we want to invest $10,000 in the company, giving us a return of $1,000 per year.
We could put up that $10,000 ourselves and settle for a return of 10% a year, or we could borrow $5,000 at 5% interest rates, and only put up $5,000 of our own money:
Debt funding
Equity funding
Invested capital
Total return
Return to debt holders
Return to equity holders
% Return on equity
$0
$10,000
$10,000
$1,000
$0
$1,000
$1,000 / $10,000 = 10%
$5,000
$5,000
$10,000
$1,000
$5,000 x 5%= $250
$750
$750 / $5,000 = 15%
By funding half the business with debt at 5% interest rate, we’ve created an additional 5% of return for our equity holder!
In fact, if you think about it, as long as the interest rate paid for debt is below the ROIC, it always makes sense, in this example, to fund the business with debt — Since the debt holders demand a return less than the ROIC, the difference (ROIC – interest rate) effectively accrues to the equity holder.
ROIC vs CROIC
In our little toy example of a perfect business, ROIC = CROIC, as there are no taxes and the business is perfectly scalable with no drag (i.e. no depreciation nor amortization). In the real world, this is generally not true, and the difference between ROIC and CROIC is important!
ROIC measures how profitable a company is overall, while CROIC measures how good a company is at generating cash. Because debt interest payments are tax deductible, and because depreciation and amortization are tax deductible too, a company has some leeway to manipulate its funding sources (invested capital) to try and reduce its total taxes paid. For example, the more a company funds itself with debt, the higher ROIC it will generally be able to report, all else equal, as we’ve seen from above.
Furthermore, some businesses do not pay corporate taxes — REITs are a famous example, and instead, their shareholders pay taxes for profits directly on their own tax returns.
Finally, some businesses have depreciation and amortization costs that are far higher than what it actually costs the businesses — REITs again are a famous example, with proper maintenance, buildings tend to depreciate less than the accounting depreciation suggests.
For these reasons, generally speaking, most businesses should be valued on their ROIC, while real estate heavy businesses are generally better evaluated on their CROIC.
ROIC vs risk
In our perfect business example, because there is no risk, it is always preferable for the equity shareholders to fund the company with debt as long as the interest rate is below the ROIC. That is not always true in the real world — often, businesses tend to get less efficient after they reach a certain size, so infinite growth is impossible (edit: prior version had a typo saying infinite growth was possible — it’s not). Also, companies tend to get more risky as they take on more debt, as debt payments are mandatory, while equity dividends can generally be skipped without much financial repercussions — if a company falls on hard times, it can conserve cash by reducing or even skipping dividends, but it generally cannot reduce nor skip debt payments without an event of default.
Debt buyers understand that the more debt a business takes on, the more risky the debt becomes as there is less of an equity cushion if something goes wrong. As such, they’ll demand higher interest rates as the debt to equity ratio goes up.
Which is to say, the more debt a company takes on, the more levered it is, the more risky it tends to be. Though if everything works out, the more profitable for the equity shareholders it will be as well.
Footnotes
This isn’t exactly correct — certain non-cash expenditures such as stock based compensation, changes in inventory levels, etc. are taking out as well. For the purposes of this discussion, this is close enough.
This is a quick note, which tends to be just off the cuff thoughts/ideas that look at current market situations, and to try to encourage some discussions.
It’s early August, just one month away from the seasonally weakest month of the year for stocks, September. Time to make some moves?
As usual, a reminder that I am not a financial professional by training — I am a software engineer by training, and by trade. The following is based on my personal understanding, which is gained through self-study and working in finance for a few years.
If you find anything that you feel is incorrect, please feel free to leave a comment, and discuss your thoughts.
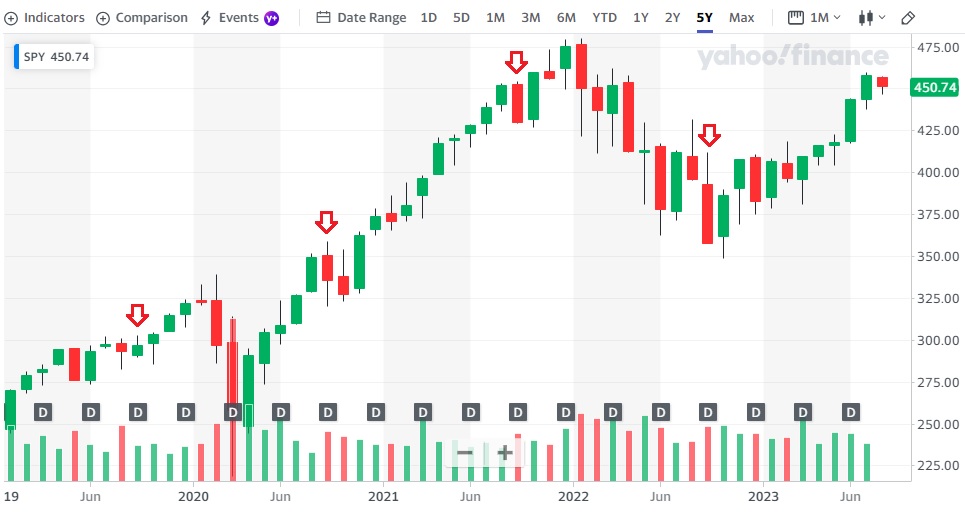
Whatever you may believe, it is undeniable that there is a fairly strong negative August/September effect for stocks:
SPY performance since 2019, monthly bars with Septembers annotated. Courtesy of Yahoo! Finance.
My portfolio
If you’ve been following me on StockClubs (1), an app that I’ve invested in, you may remember that I flattened my portfolio on September 2021, which worked out well initially with 2022 being a terrible year for stocks in general. However, at the end of 2022, I also initiated a bunch of shorts thinking the weakness will persist, but of course the market gods just laughed in my face and the market ripped higher (2).
As September 2023 rolls around, I’m getting that uneasy feeling again in the pits of my stomach, and if you’re still following me on StockClubs, you’ll note that I bought a put spread, betting that markets will be quite a bit weaker by mid November.
Why, why, tell me why
To be clear, I have a spotty track record at best at timing the markets, and unless you like losing money, it may not be prudent to follow in this fool’s quest. But here are some of the issues weighing on my mind:
Another concern is that of inflation, the boogeyman from 2021/2022 that may be making a comeback. In 2021, inflation was an issue, but it didn’t really kick into high gear until late 2021 into early 2022, especially after the Russian invasion of Ukraine.
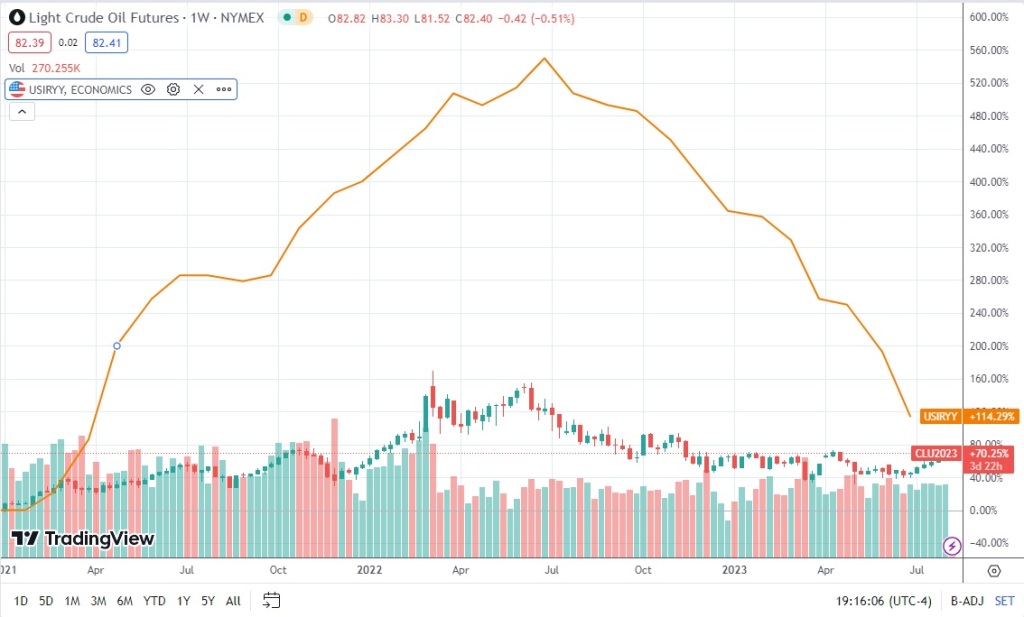
A large part of this was due to the huge spike in crude oil prices after the invasion, but which also started coming down around mid June 2022. As you can see from the graph below, inflation (orange line) looks almost like a slightly lagged, and very exaggerated version of crude oil price (candle bars):
Crude oil futures prices vs US CPI YoY inflation, weekly bars. Courtesy of TradingView.
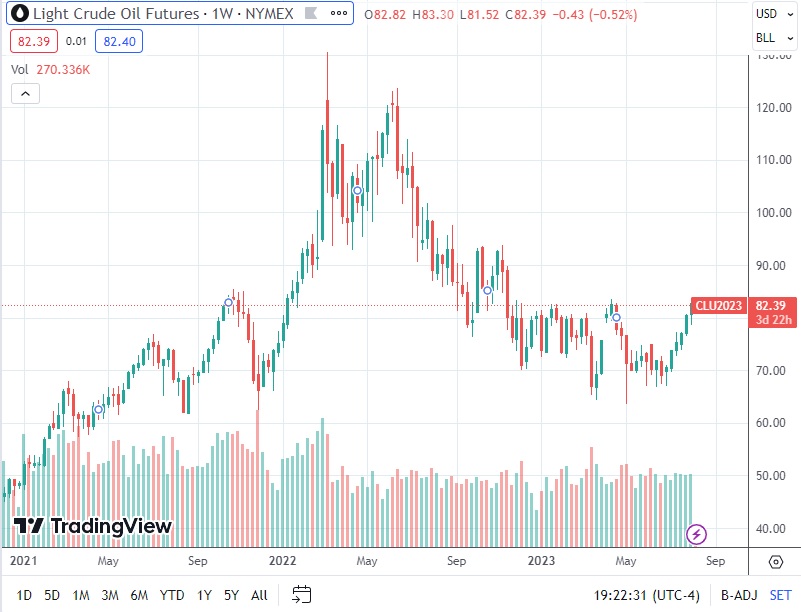
Right now, it appears that crude oil prices is moving up again, but unlikely early 2023 when crude was around the same levels now, crude oil prices in July 2022 was much lower than crude oil prices in January to June 2022:
Crude oil futures prices, weekly bars. Courtesy of TradingView.
As a result, the drag of crude oil prices on year over year CPI is likely to be much less muted in July than for the first half of the year.
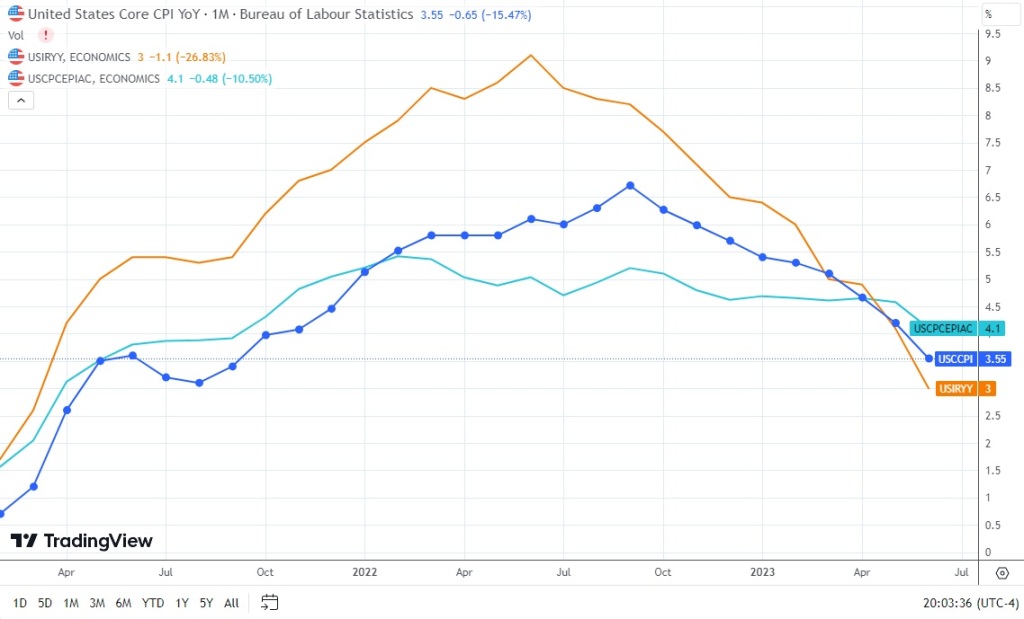
One way of visualizing crude oil prices’ impact on CPI inflation is by comparing CPI inflation (orange line) to core PCE inflation (teal line) and core CPI inflation (blue line) — core PCE inflation and core CPI inflation exclude the effects of food and energy prices:
Differences in inflation measures. Courtesy of TradingView.
As can be seen, the core inflation measures are much less affected by the spike in energy prices from February 2022 to June 2022. This in turn suggests that while the core measures may continue their down trends, headline CPI inflation may see moderate its decline, and may even inflect slightly higher for July. CPI inflation measures are due this Thursday, August 10th.
Weakening earnings
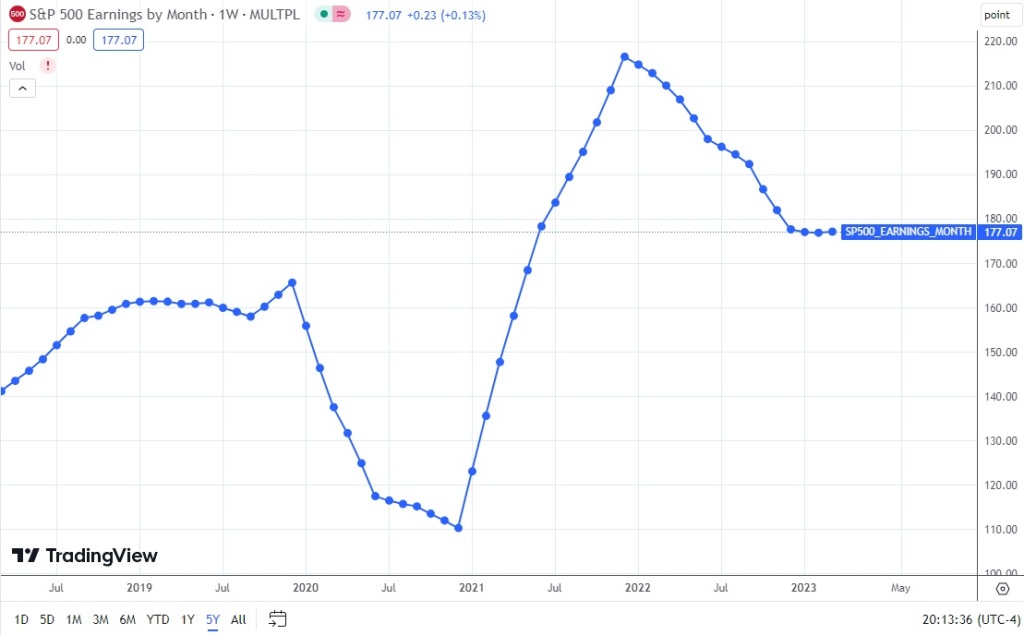
Earnings for the S&P500 has been weakening steadily since early 2022:
S&P500 earnings, monthly. Courtesy of TradingView.
While the weakening seemed to have plateaued in early 2023, recent earnings report (especially from Apple, the largest company by market cap in the USA) seems to suggest that the weakening may be reaccelerating. To be clear, earnings season for 2023Q2 isn’t over, and the weakening may just my overthinking it.
Technicals
Unless you’ve been living under a rock, you’d know that the markets have done pretty well so far this year. Some may say too well — on a short term basis, it seems like the markets may be taking a breather, with a small plateau forming. A plateau that I’m betting (hoping!) will turn into a small correction in the near term.
Final words
As always, I want to be very clear that I cannot predict the future, and that this bet that the markets will go down is a very small part of my portfolio. This is, for now, a short term trade, which I may close out or reverse at any time. Follow at your own risk.
Footnotes
Disclaimer: I’m only listing 1 (out of 10+) of my brokerage accounts on StockClubs. While it is one of the largest brokerage account in terms of asset value, it is still less than 10% of my portfolio.


 Janky Thoughts